
Seller's Agent in 2025
Terry Ziegler
Reece Nichols South Central Kansas
(316) 650-2140
95 Total Sales


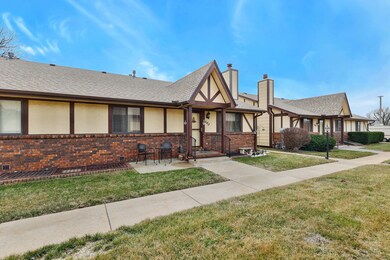
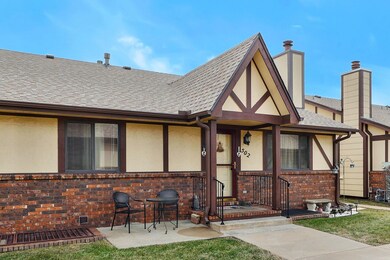
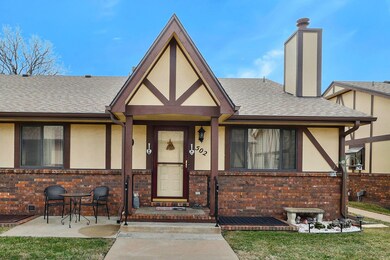
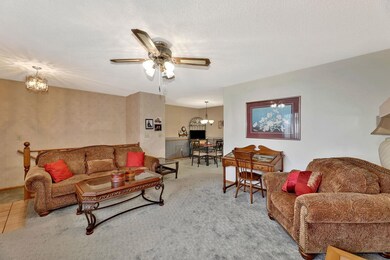
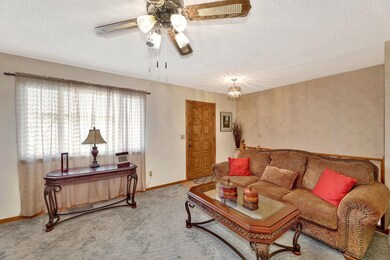
Rare opportunity for a ranch unit at Twin Oaks Condos! 2 bedrooms and 2 full baths. All appliances remain with the unit, oven/range, dishwasher, refrigerator, washer and dryer. Gas fireplace in the living room, very roomy master bedroom with a walk-in closet. The lower level has a rec/family room, large second bedroom, walk-in closet, full bath, and storage room. Charming patio in the front!
Last Agent to Sell the Property
Reece Nichols South Central Kansas License #00217256 Listed on: 04/10/2024
Home Type
Est. Annual Taxes
Year Built
HOA Fees
Parking
Home Design
Interior Spaces
Kitchen
Bedrooms and Bathrooms
Laundry
Home Security
Schools
Utilities
Listing and Financial Details
Overview
Security
| Date | Type | Sale Price | Title Company |
|---|---|---|---|
| Warranty Deed | -- | Security Abstract & Title Co |
| Date | Status | Loan Amount | Loan Type |
|---|---|---|---|
| Open | $73,520 | No Value Available |
| Date | Event | Price | Change | Sq Ft Price |
|---|---|---|---|---|
| 05/06/2025 05/06/25 | Price Changed | $121,500 | -0.8% | $119 / Sq Ft |
| 04/21/2025 04/21/25 | Price Changed | $122,500 | -2.0% | $120 / Sq Ft |
| 04/01/2025 04/01/25 | For Sale | $125,000 | 0.0% | $123 / Sq Ft |
| 02/11/2025 02/11/25 | Sold | -- | -- | -- |
| 01/23/2025 01/23/25 | Pending | -- | -- | -- |
| 01/17/2025 01/17/25 | Price Changed | $125,000 | -3.5% | $96 / Sq Ft |
| 01/08/2025 01/08/25 | For Sale | $129,500 | +7.9% | $99 / Sq Ft |
| 11/15/2024 11/15/24 | Sold | -- | -- | -- |
| 10/31/2024 10/31/24 | Sold | -- | -- | -- |
| 10/22/2024 10/22/24 | Pending | -- | -- | -- |
| 10/10/2024 10/10/24 | For Sale | $120,000 | -3.9% | $118 / Sq Ft |
| 09/16/2024 09/16/24 | Pending | -- | -- | -- |
| 07/30/2024 07/30/24 | Sold | -- | -- | -- |
| 07/12/2024 07/12/24 | For Sale | $124,900 | +8.6% | $122 / Sq Ft |
| 07/03/2024 07/03/24 | Sold | -- | -- | -- |
| 07/02/2024 07/02/24 | Pending | -- | -- | -- |
| 06/27/2024 06/27/24 | For Sale | $115,000 | 0.0% | $113 / Sq Ft |
| 06/03/2024 06/03/24 | Pending | -- | -- | -- |
| 05/28/2024 05/28/24 | Pending | -- | -- | -- |
| 05/11/2024 05/11/24 | For Sale | $115,000 | -4.2% | $113 / Sq Ft |
| 04/18/2024 04/18/24 | Price Changed | $120,000 | -10.1% | $85 / Sq Ft |
| 04/10/2024 04/10/24 | For Sale | $133,500 | +16.2% | $94 / Sq Ft |
| 11/10/2022 11/10/22 | Sold | -- | -- | -- |
| 10/12/2022 10/12/22 | Pending | -- | -- | -- |
| 10/01/2022 10/01/22 | For Sale | $114,900 | -11.6% | $113 / Sq Ft |
| 05/11/2022 05/11/22 | Sold | -- | -- | -- |
| 04/09/2022 04/09/22 | Pending | -- | -- | -- |
| 04/06/2022 04/06/22 | For Sale | $130,000 | +52.9% | $92 / Sq Ft |
| 04/04/2022 04/04/22 | Sold | -- | -- | -- |
| 02/22/2022 02/22/22 | Pending | -- | -- | -- |
| 02/18/2022 02/18/22 | For Sale | $85,000 | +6.3% | $83 / Sq Ft |
| 11/22/2021 11/22/21 | Sold | -- | -- | -- |
| 11/05/2021 11/05/21 | Pending | -- | -- | -- |
| 11/01/2021 11/01/21 | For Sale | $80,000 | -33.3% | $78 / Sq Ft |
| 02/25/2021 02/25/21 | Sold | -- | -- | -- |
| 01/23/2021 01/23/21 | Pending | -- | -- | -- |
| 01/18/2021 01/18/21 | For Sale | $120,000 | +50.2% | $83 / Sq Ft |
| 09/02/2020 09/02/20 | Sold | -- | -- | -- |
| 07/25/2020 07/25/20 | Pending | -- | -- | -- |
| 07/24/2020 07/24/20 | For Sale | $79,900 | -33.4% | $78 / Sq Ft |
| 12/27/2019 12/27/19 | Sold | -- | -- | -- |
| 11/14/2019 11/14/19 | Pending | -- | -- | -- |
| 10/29/2019 10/29/19 | For Sale | $119,900 | +53.7% | $75 / Sq Ft |
| 08/18/2017 08/18/17 | Sold | -- | -- | -- |
| 08/14/2017 08/14/17 | Pending | -- | -- | -- |
| 03/14/2017 03/14/17 | For Sale | $78,000 | -21.2% | $48 / Sq Ft |
| 11/16/2016 11/16/16 | Sold | -- | -- | -- |
| 11/10/2016 11/10/16 | Sold | -- | -- | -- |
| 10/22/2016 10/22/16 | Pending | -- | -- | -- |
| 10/06/2016 10/06/16 | Pending | -- | -- | -- |
| 09/26/2016 09/26/16 | For Sale | $99,000 | +65.3% | $68 / Sq Ft |
| 04/26/2016 04/26/16 | For Sale | $59,900 | -40.0% | $59 / Sq Ft |
| 04/25/2016 04/25/16 | Sold | -- | -- | -- |
| 03/20/2016 03/20/16 | Pending | -- | -- | -- |
| 02/10/2016 02/10/16 | For Sale | $99,900 | 0.0% | $62 / Sq Ft |
| 02/01/2016 02/01/16 | Sold | -- | -- | -- |
| 01/12/2016 01/12/16 | Pending | -- | -- | -- |
| 11/09/2015 11/09/15 | For Sale | $99,900 | +25.0% | $64 / Sq Ft |
| 04/15/2015 04/15/15 | Sold | -- | -- | -- |
| 03/15/2015 03/15/15 | Pending | -- | -- | -- |
| 07/18/2014 07/18/14 | For Sale | $79,900 | -20.0% | $56 / Sq Ft |
| 11/14/2013 11/14/13 | Sold | -- | -- | -- |
| 10/13/2013 10/13/13 | Pending | -- | -- | -- |
| 09/23/2013 09/23/13 | For Sale | $99,900 | +42.7% | $61 / Sq Ft |
| 03/29/2013 03/29/13 | Sold | -- | -- | -- |
| 02/23/2013 02/23/13 | Pending | -- | -- | -- |
| 07/16/2012 07/16/12 | For Sale | $70,000 | -- | $69 / Sq Ft |
| Year | Tax Paid | Tax Assessment Tax Assessment Total Assessment is a certain percentage of the fair market value that is determined by local assessors to be the total taxable value of land and additions on the property. | Land | Improvement |
|---|---|---|---|---|
| 2025 | $1,325 | $15,537 | $2,243 | $13,294 |
| 2023 | $1,325 | $13,042 | $1,346 | $11,696 |
| 2022 | $1,234 | $11,443 | $1,265 | $10,178 |
| 2021 | $1,216 | $10,799 | $1,265 | $9,534 |
| 2020 | $1,185 | $10,488 | $1,265 | $9,223 |
| 2019 | $1,140 | $10,086 | $1,265 | $8,821 |
| 2018 | $1,096 | $9,695 | $1,495 | $8,200 |
| 2017 | $1,170 | $0 | $0 | $0 |
| 2016 | $1,121 | $0 | $0 | $0 |
| 2015 | -- | $0 | $0 | $0 |
| 2014 | -- | $0 | $0 | $0 |
Seller's Agent in 2025
Terry Ziegler
Reece Nichols South Central Kansas
(316) 650-2140
95 Total Sales
Seller's Agent in 2025
Cari Palesano
Berkshire Hathaway PenFed Realty
(316) 992-7753
1 in this area
26 Total Sales
Seller's Agent in 2024
Janelle Moore
Platinum Realty LLC
(316) 312-9179
1 in this area
25 Total Sales
Seller's Agent in 2024
Ali Hayden
LPT Realty, LLC
(800) 268-8117
2 in this area
65 Total Sales
L
Seller's Agent in 2024
Lisa Nagabhushan
Berkshire Hathaway PenFed Realty
(316) 631-5994
3 in this area
76 Total Sales
Seller's Agent in 2024
DANIELLE WILDEMAN
Reece Nichols South Central Kansas
(316) 641-1212
3 in this area
114 Total Sales
Source: South Central Kansas MLS
MLS Number: 637577
APN: 136-24-0-23-02-014.01
Disclaimer: Certain information contained herein is derived from information provided by parties other than Homes.com. All information provided is deemed reliable, but is not guaranteed to be accurate and should be independently verified.
![]() IDX information is provided exclusively for personal, non-commercial use, and may not be used for any purpose other than to identify prospective properties consumers may be interested in purchasing. This information is not verified for authenticity or accuracy, is not guaranteed and may not reflect all real estate activity in the market. © 1993-2025 South Central Kansas Multiple Listing Service, Inc. All rights reserved.
IDX information is provided exclusively for personal, non-commercial use, and may not be used for any purpose other than to identify prospective properties consumers may be interested in purchasing. This information is not verified for authenticity or accuracy, is not guaranteed and may not reflect all real estate activity in the market. © 1993-2025 South Central Kansas Multiple Listing Service, Inc. All rights reserved.