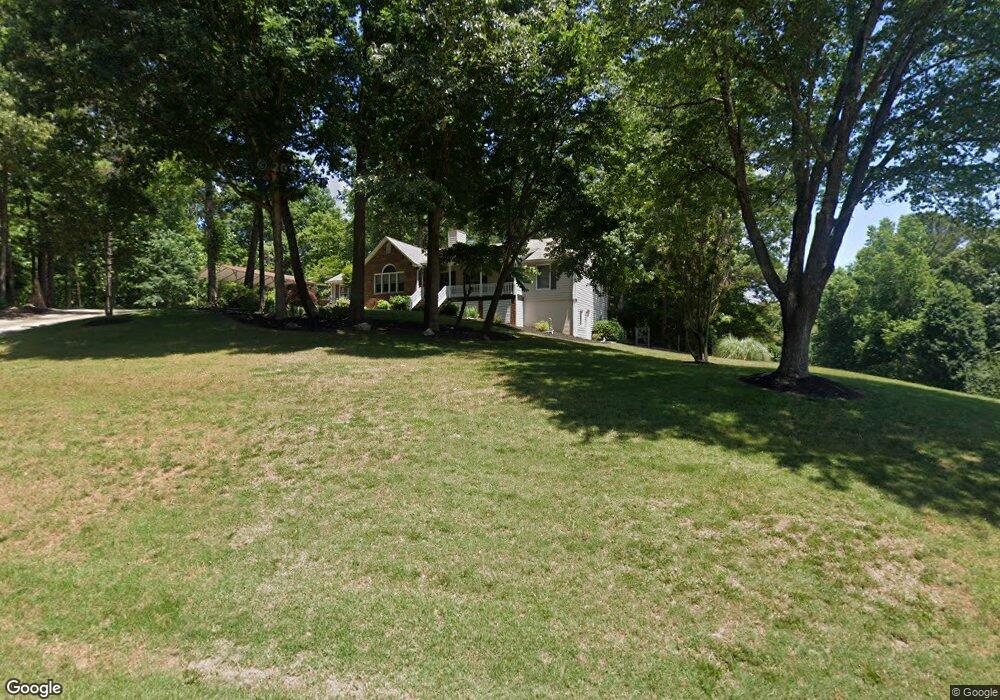
3537 Stancil Rd Gainesville, GA 30506
Estimated Value: $393,000 - $435,000
3
Beds
3
Baths
1,747
Sq Ft
$235/Sq Ft
Est. Value
About This Home
This home is located at 3537 Stancil Rd, Gainesville, GA 30506 and is currently estimated at $410,213, approximately $234 per square foot. 3537 Stancil Rd is a home located in Hall County with nearby schools including Riverbend Elementary School, North Hall Middle School, and North Hall High School.
Ownership History
Date
Name
Owned For
Owner Type
Purchase Details
Closed on
Dec 31, 2013
Sold by
Taylor Robin E and Taylor Joh
Bought by
Taylor John C and Taylor Robin E
Current Estimated Value
Purchase Details
Closed on
Feb 20, 1998
Sold by
Lenhart Susan D
Bought by
Taylor Robin E and Taylor John C
Home Financials for this Owner
Home Financials are based on the most recent Mortgage that was taken out on this home.
Original Mortgage
$98,000
Interest Rate
6.89%
Mortgage Type
New Conventional
Purchase Details
Closed on
May 25, 1994
Sold by
Allison Audrey Jeffrey
Bought by
Lenhart Susan
Home Financials for this Owner
Home Financials are based on the most recent Mortgage that was taken out on this home.
Original Mortgage
$106,250
Interest Rate
5.87%
Create a Home Valuation Report for This Property
The Home Valuation Report is an in-depth analysis detailing your home's value as well as a comparison with similar homes in the area
Home Values in the Area
Average Home Value in this Area
Purchase History
| Date | Buyer | Sale Price | Title Company |
|---|---|---|---|
| Taylor John C | -- | -- | |
| Taylor Robin E | $139,900 | -- | |
| Lenhart Susan | $125,000 | -- |
Source: Public Records
Mortgage History
| Date | Status | Borrower | Loan Amount |
|---|---|---|---|
| Previous Owner | Taylor Robin E | $98,000 | |
| Previous Owner | Lenhart Susan | $106,250 |
Source: Public Records
Tax History Compared to Growth
Tax History
| Year | Tax Paid | Tax Assessment Tax Assessment Total Assessment is a certain percentage of the fair market value that is determined by local assessors to be the total taxable value of land and additions on the property. | Land | Improvement |
|---|---|---|---|---|
| 2024 | $3,355 | $134,876 | $45,080 | $89,796 |
| 2023 | $3,389 | $130,756 | $45,080 | $85,676 |
| 2022 | $2,729 | $105,116 | $35,200 | $69,916 |
| 2021 | $2,700 | $102,128 | $35,200 | $66,928 |
| 2020 | $2,694 | $99,008 | $35,200 | $63,808 |
| 2019 | $2,719 | $99,088 | $39,360 | $59,728 |
| 2018 | $2,514 | $88,648 | $34,520 | $54,128 |
| 2017 | $2,352 | $83,768 | $34,520 | $49,248 |
| 2016 | $2,033 | $74,088 | $24,840 | $49,248 |
| 2015 | $1,621 | $74,088 | $24,840 | $49,248 |
| 2014 | $1,621 | $90,928 | $39,440 | $51,488 |
Source: Public Records
Map
Nearby Homes
- 3481 Maynard Cir
- 3464 Maynard Cir
- 3438 Clarks Bridge Crossing
- 3235 Clarks Bridge Rd
- 3515 S Bend Rd
- 3309 Chaney Cir
- 3343 Barry Ln
- 3621 Griffin Dr
- 3474 Leisure Ln
- 3435 Leisure Ln
- 2600 Ramsey Rd
- 3632 Clarks Bridge Rd
- 3320 Winterberry Ln
- 4 Winterberry Ln
- TRACT 5 Winterberry Ln
- TRACT 2 Winterberry Ln
- 1 Winterberry Ln
- 3 Winterberry Ln
- 7 Winterberry Ln
- 5 Winterberry Ln
- 3505 Southview Cir
- 3509 Southview Cir
- 3502 Southview Cir
- 3513 Southview Cir
- 0 Southview Cir
- 3416 Stancil Rd
- 0 Stancil Rd Unit 8108402
- 0 Stancil Rd Unit 7064826
- 0 Stancil Rd Unit 3238238
- 0 Stancil Rd Unit 8043542
- 0 Stancil Rd Unit 7203146
- 0 Stancil Rd Unit 3102414
- 0 Stancil Rd
- 3522 Southview Cir
- 3449 Stancil Rd
- 3523 Southview Cir
- 3464 Stancil Rd
- 3525 Stancil Rd
- 3448 Stancil Rd
- 3527 Southview Cir