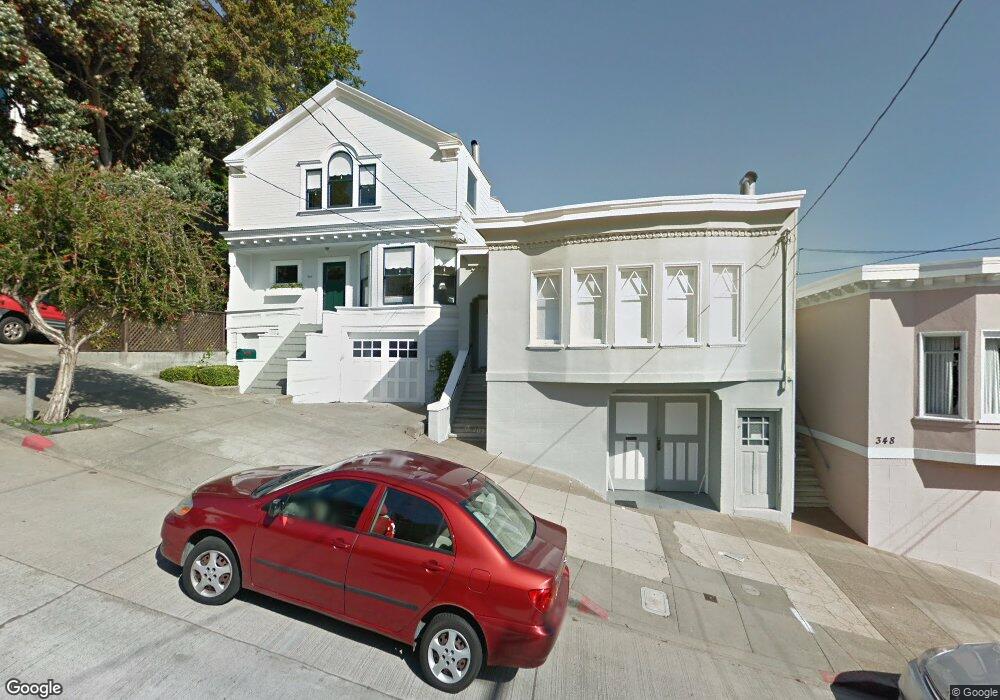
354 28th St San Francisco, CA 94131
Noe Valley NeighborhoodEstimated Value: $1,689,000 - $3,000,000
2
Beds
1
Bath
1,175
Sq Ft
$2,212/Sq Ft
Est. Value
About This Home
This home is located at 354 28th St, San Francisco, CA 94131 and is currently estimated at $2,598,565, approximately $2,211 per square foot. 354 28th St is a home located in San Francisco County with nearby schools including Alvarado Elementary, James Lick Middle School, and St. Philip School.
Ownership History
Date
Name
Owned For
Owner Type
Purchase Details
Closed on
Jun 30, 2022
Sold by
Vaughan Williams Cerie and Donovan John
Bought by
Williams-Kolano Revocable Trust
Current Estimated Value
Purchase Details
Closed on
Apr 25, 2014
Sold by
Dalpino Donald J and The Donald J & Janet S Dalpino
Bought by
Williams Ceri and Kolano John
Home Financials for this Owner
Home Financials are based on the most recent Mortgage that was taken out on this home.
Original Mortgage
$1,220,000
Interest Rate
3.5%
Mortgage Type
Adjustable Rate Mortgage/ARM
Create a Home Valuation Report for This Property
The Home Valuation Report is an in-depth analysis detailing your home's value as well as a comparison with similar homes in the area
Home Values in the Area
Average Home Value in this Area
Purchase History
| Date | Buyer | Sale Price | Title Company |
|---|---|---|---|
| Williams-Kolano Revocable Trust | -- | Spears & Shelf Llp | |
| Williams Ceri | $1,525,000 | First American Title Company |
Source: Public Records
Mortgage History
| Date | Status | Borrower | Loan Amount |
|---|---|---|---|
| Previous Owner | Williams Ceri | $1,220,000 |
Source: Public Records
Tax History Compared to Growth
Tax History
| Year | Tax Paid | Tax Assessment Tax Assessment Total Assessment is a certain percentage of the fair market value that is determined by local assessors to be the total taxable value of land and additions on the property. | Land | Improvement |
|---|---|---|---|---|
| 2025 | $32,003 | $2,708,529 | $1,308,601 | $1,399,928 |
| 2024 | $32,003 | $2,655,423 | $1,282,943 | $1,372,480 |
| 2023 | $31,485 | $2,603,357 | $1,257,788 | $1,345,569 |
| 2022 | $30,895 | $2,552,312 | $1,233,126 | $1,319,186 |
| 2021 | $30,355 | $2,502,268 | $1,208,948 | $1,293,320 |
| 2020 | $30,523 | $2,476,612 | $1,196,552 | $1,280,060 |
| 2019 | $29,476 | $2,428,052 | $1,173,091 | $1,254,961 |
| 2018 | $27,792 | $2,321,285 | $1,150,090 | $1,171,195 |
| 2017 | $27,168 | $2,275,771 | $1,127,540 | $1,148,231 |
| 2016 | $19,066 | $1,579,188 | $1,105,432 | $473,756 |
| 2015 | $18,829 | $1,555,468 | $1,088,828 | $466,640 |
| 2014 | $4,821 | $374,258 | $286,674 | $87,584 |
Source: Public Records
Map
Nearby Homes