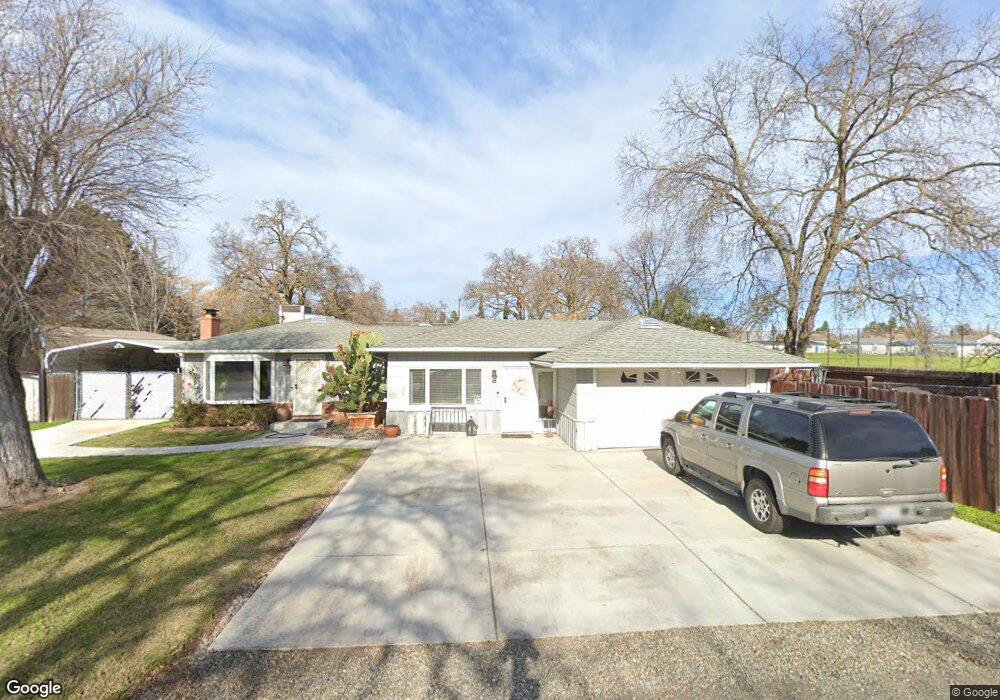
3541 Winona Way North Highlands, CA 95660
Arcade Park NeighborhoodEstimated Value: $531,000 - $590,720
3
Beds
2
Baths
2,312
Sq Ft
$248/Sq Ft
Est. Value
About This Home
This home is located at 3541 Winona Way, North Highlands, CA 95660 and is currently estimated at $573,180, approximately $247 per square foot. 3541 Winona Way is a home located in Sacramento County with nearby schools including Pasadena Avenue Elementary School, Winston Churchill Middle School, and Mira Loma High School.
Ownership History
Date
Name
Owned For
Owner Type
Purchase Details
Closed on
Jul 13, 2004
Sold by
Sanders Paul Adrian
Bought by
Serpa Ginna Marrie and Herrera Frank
Current Estimated Value
Home Financials for this Owner
Home Financials are based on the most recent Mortgage that was taken out on this home.
Original Mortgage
$292,000
Outstanding Balance
$145,209
Interest Rate
6.15%
Mortgage Type
Purchase Money Mortgage
Estimated Equity
$427,971
Purchase Details
Closed on
May 27, 2003
Sold by
Sanders Paul Adrian and Hale David Alan
Bought by
Sanders Paul Adrian
Home Financials for this Owner
Home Financials are based on the most recent Mortgage that was taken out on this home.
Original Mortgage
$163,000
Interest Rate
5.71%
Mortgage Type
Purchase Money Mortgage
Purchase Details
Closed on
May 20, 1999
Sold by
Skjold Donald W and Skjold Nancy A
Bought by
Sanders Paul Adrian and Hale David Alan
Home Financials for this Owner
Home Financials are based on the most recent Mortgage that was taken out on this home.
Original Mortgage
$161,746
Interest Rate
6.86%
Mortgage Type
FHA
Create a Home Valuation Report for This Property
The Home Valuation Report is an in-depth analysis detailing your home's value as well as a comparison with similar homes in the area
Home Values in the Area
Average Home Value in this Area
Purchase History
| Date | Buyer | Sale Price | Title Company |
|---|---|---|---|
| Serpa Ginna Marrie | $365,000 | First American Title Co | |
| Sanders Paul Adrian | -- | Chicago Title | |
| Sanders Paul Adrian | $155,000 | Financial Title Company |
Source: Public Records
Mortgage History
| Date | Status | Borrower | Loan Amount |
|---|---|---|---|
| Open | Serpa Ginna Marrie | $292,000 | |
| Previous Owner | Sanders Paul Adrian | $163,000 | |
| Previous Owner | Sanders Paul Adrian | $161,746 |
Source: Public Records
Tax History Compared to Growth
Tax History
| Year | Tax Paid | Tax Assessment Tax Assessment Total Assessment is a certain percentage of the fair market value that is determined by local assessors to be the total taxable value of land and additions on the property. | Land | Improvement |
|---|---|---|---|---|
| 2025 | $5,930 | $508,764 | $97,566 | $411,198 |
| 2024 | $5,930 | $498,789 | $95,653 | $403,136 |
| 2023 | $5,771 | $489,010 | $93,778 | $395,232 |
| 2022 | $5,739 | $479,423 | $91,940 | $387,483 |
| 2021 | $6,254 | $470,024 | $90,138 | $379,886 |
| 2020 | $5,543 | $465,205 | $89,214 | $375,991 |
| 2019 | $5,720 | $427,084 | $81,905 | $345,179 |
| 2018 | $4,784 | $399,145 | $76,547 | $322,598 |
| 2017 | $4,859 | $359,591 | $68,962 | $290,629 |
| 2016 | $3,627 | $315,431 | $60,493 | $254,938 |
| 2015 | $3,587 | $286,756 | $54,994 | $231,762 |
| 2014 | $3,034 | $265,514 | $50,920 | $214,594 |
Source: Public Records
Map
Nearby Homes
- 4963 Eleven Oaks Ln
- 3650 Ohio Ln Unit 82
- 3925 Ward Ave
- 5252- Jackson St
- 4824 Liberty Bell Ln
- 4121 Chesapeake Ln
- 5040 Jackson St Unit 106
- 5040 Jackson St Unit 169
- 5040 Jackson St Unit 135
- 5040 Jackson St Unit 18
- 5040 Jackson St Unit 48
- 5040 Jackson St Unit 60
- 5040 Jackson St Unit 93
- 5040 Jackson St Unit 91
- 5040 Jackson St Unit 152
- 5010 Lorijo Way
- 4124 Vicksburg Ln Unit 176
- 3921 Renick Way
- 5020 Valley Forge Ln
- 4202 Ticonderoga Ln
- 3537 Winona Way
- 4804 Palomino Ln
- 4806 Palomino Ln
- 4810 Palomino Ln
- 3550 Winona Way
- 4816 Palomino Ln
- 4805 Palomino Ln
- 4720 Palomino Ln
- 4807 Palomino Ln
- 4811 Palomino Ln
- 3517 Winona Way
- 4721 Palomino Ln
- 4815 Palomino Ln
- 3549 Oak Dell Ave
- 3541 Oak Dell Ave
- 3610 Winona Way
- 4830 Palomino Ln
- 4700 Palomino Ln
- 3601 Oak Dell Ave
- 3511 Winona Way