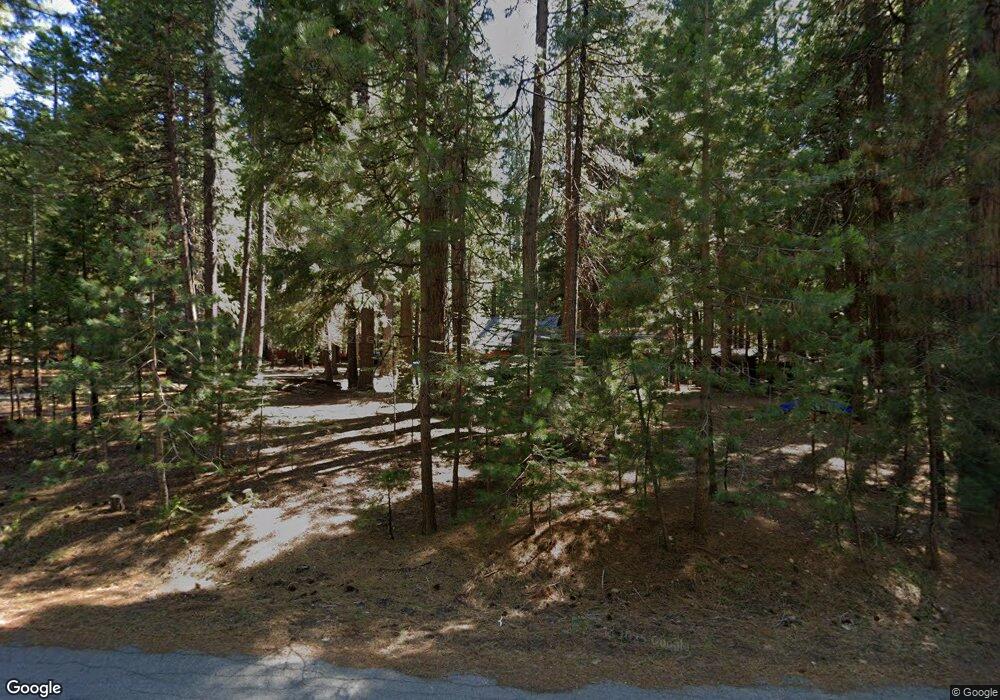
35433 Colossians Way Shingletown, CA 96088
Estimated Value: $259,000 - $303,000
1
Bed
1
Bath
1,317
Sq Ft
$211/Sq Ft
Est. Value
About This Home
This home is located at 35433 Colossians Way, Shingletown, CA 96088 and is currently estimated at $278,401, approximately $211 per square foot. 35433 Colossians Way is a home located in Shasta County with nearby schools including Black Butte Elementary School, Black Butte Junior High School, and Foothill High School.
Ownership History
Date
Name
Owned For
Owner Type
Purchase Details
Closed on
Apr 10, 2006
Sold by
Stewart Richard Leister and Stewart Georgia Ann
Bought by
Stewart Richard L and Stewart Georgia
Current Estimated Value
Home Financials for this Owner
Home Financials are based on the most recent Mortgage that was taken out on this home.
Original Mortgage
$382,500
Outstanding Balance
$219,302
Interest Rate
6.32%
Mortgage Type
FHA
Estimated Equity
$59,099
Purchase Details
Closed on
Mar 30, 2006
Sold by
Va
Bought by
Stewart Richard L and Stewart Georgia
Home Financials for this Owner
Home Financials are based on the most recent Mortgage that was taken out on this home.
Original Mortgage
$382,500
Outstanding Balance
$219,302
Interest Rate
6.32%
Mortgage Type
FHA
Estimated Equity
$59,099
Purchase Details
Closed on
Jan 25, 2001
Sold by
Stewart Richard L and Stewart Georgia
Bought by
Stewart Richard L and Stewart Georgia
Create a Home Valuation Report for This Property
The Home Valuation Report is an in-depth analysis detailing your home's value as well as a comparison with similar homes in the area
Home Values in the Area
Average Home Value in this Area
Purchase History
| Date | Buyer | Sale Price | Title Company |
|---|---|---|---|
| Stewart Richard L | -- | First American Title Co | |
| Stewart Richard Leister | -- | First American Title Co | |
| Stewart Richard L | -- | First American Title Co | |
| Stewart Richard L | -- | -- |
Source: Public Records
Mortgage History
| Date | Status | Borrower | Loan Amount |
|---|---|---|---|
| Open | Stewart Richard Leister | $382,500 | |
| Closed | Stewart Richard L | $382,500 |
Source: Public Records
Tax History Compared to Growth
Tax History
| Year | Tax Paid | Tax Assessment Tax Assessment Total Assessment is a certain percentage of the fair market value that is determined by local assessors to be the total taxable value of land and additions on the property. | Land | Improvement |
|---|---|---|---|---|
| 2025 | $1,394 | $135,849 | $25,862 | $109,987 |
| 2024 | $1,370 | $133,186 | $25,355 | $107,831 |
| 2023 | $1,370 | $130,575 | $24,858 | $105,717 |
| 2022 | $1,336 | $128,016 | $24,371 | $103,645 |
| 2021 | $1,293 | $125,507 | $23,894 | $101,613 |
| 2020 | $1,314 | $124,221 | $23,649 | $100,572 |
| 2019 | $1,276 | $121,786 | $23,186 | $98,600 |
| 2018 | $1,260 | $119,399 | $22,732 | $96,667 |
| 2017 | $1,253 | $117,059 | $22,287 | $94,772 |
| 2016 | $1,182 | $114,764 | $21,850 | $92,914 |
| 2015 | $1,132 | $113,041 | $21,522 | $91,519 |
| 2014 | $1,117 | $110,828 | $21,101 | $89,727 |
Source: Public Records
Map
Nearby Homes
- Lot # 6 Colossians Way
- Lot 18 Nehemiah Dr
- 35344 Philippian Way
- 10467 Ritts Mill Rd
- 9279 Thatcher Mill Rd
- 35267 Nehemiah Dr
- 0 Douglas Fir Ct
- 9312 Mountain Meadow Rd
- 8876 Warner Way
- 35425 Stonewall Dr
- 0 Manzanita Creek Dr
- 8681 Savannah Way
- 0 Savannah Way
- 8637 Savannah Way
- 0 Ritts Mill Rd
- 36088 Deer Flat Rd
- 8379 A and J Ln
- 34820 Emigrant Trail
- 34739 Timber Ridge Rd
- 35486 Wild Turkey Ln
- 35451 Colossians Way
- 35418 Bethany Way
- 35426 Bethany Way
- 0 Colossians Lot #6
- 35400 Colossians Way
- 35380 Colossians Way
- 35469 Colossians Way
- 000 Bethany Way
- #20 Bethany Way
- 4 Bethany Way
- 15 Bethany Way
- # 5 Bethany Way
- #14 Bethany Way
- 5 Bethany Way
- 17 Bethany Way
- Lot 20 Bethany Way
- Lot 14 Bethany Way
- Lot # 14 Bethany Way
- 35444 Bethany Way
- 35470 Colossians Way