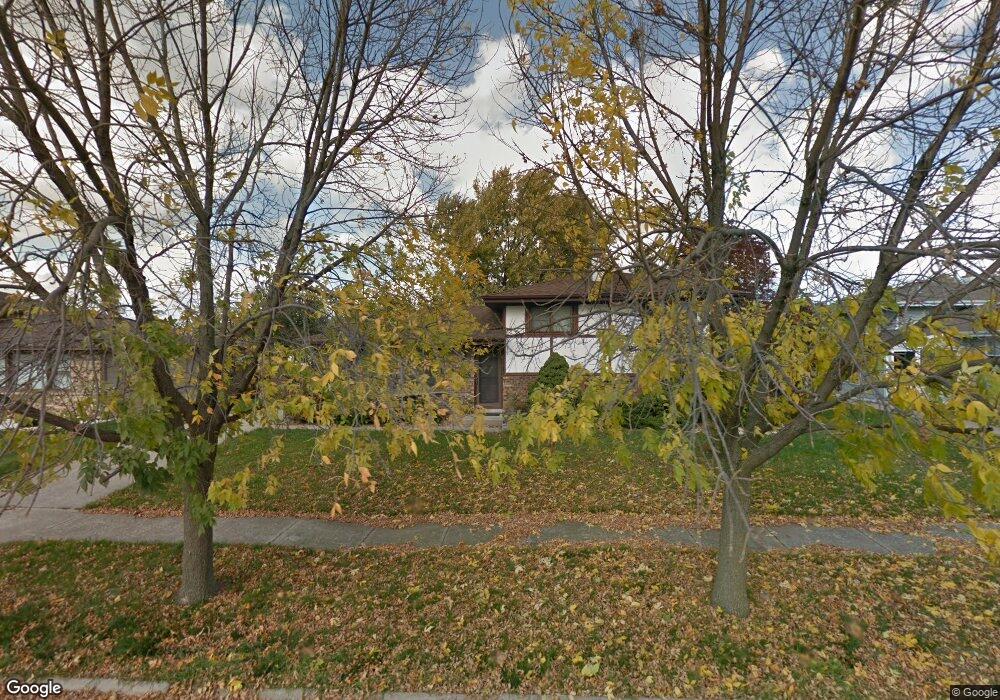
3544 192nd St Lansing, IL 60438
Estimated Value: $224,000 - $310,000
3
Beds
2
Baths
1,797
Sq Ft
$146/Sq Ft
Est. Value
About This Home
This home is located at 3544 192nd St, Lansing, IL 60438 and is currently estimated at $262,969, approximately $146 per square foot. 3544 192nd St is a home located in Cook County with nearby schools including Nathan Hale Elementary School, Heritage Middle School, and Thornton Fractnl So High School.
Ownership History
Date
Name
Owned For
Owner Type
Purchase Details
Closed on
Mar 5, 2008
Sold by
Federal Home Loan Mortgage Corporation
Bought by
Coleman James W
Current Estimated Value
Home Financials for this Owner
Home Financials are based on the most recent Mortgage that was taken out on this home.
Original Mortgage
$147,900
Interest Rate
6.17%
Mortgage Type
Purchase Money Mortgage
Purchase Details
Closed on
Jul 3, 2002
Sold by
Swatosh David J and Swatosh Venessa
Bought by
Brooks Margo L
Home Financials for this Owner
Home Financials are based on the most recent Mortgage that was taken out on this home.
Original Mortgage
$153,900
Interest Rate
7.5%
Purchase Details
Closed on
Jul 26, 1994
Sold by
Vanderhoek John O and Vanderhoek Patricia S
Bought by
Swatosh David J and Vlahos Vanessa R
Home Financials for this Owner
Home Financials are based on the most recent Mortgage that was taken out on this home.
Original Mortgage
$107,200
Interest Rate
8.38%
Create a Home Valuation Report for This Property
The Home Valuation Report is an in-depth analysis detailing your home's value as well as a comparison with similar homes in the area
Home Values in the Area
Average Home Value in this Area
Purchase History
| Date | Buyer | Sale Price | Title Company |
|---|---|---|---|
| Coleman James W | $152,500 | First American Title | |
| Brooks Margo L | $162,000 | -- | |
| Swatosh David J | $114,000 | -- |
Source: Public Records
Mortgage History
| Date | Status | Borrower | Loan Amount |
|---|---|---|---|
| Previous Owner | Coleman James W | $147,900 | |
| Previous Owner | Brooks Margo L | $153,900 | |
| Previous Owner | Swatosh David J | $107,200 |
Source: Public Records
Tax History
| Year | Tax Paid | Tax Assessment Tax Assessment Total Assessment is a certain percentage of the fair market value that is determined by local assessors to be the total taxable value of land and additions on the property. | Land | Improvement |
|---|---|---|---|---|
| 2025 | $8,774 | $23,884 | $4,496 | $19,388 |
| 2024 | $8,774 | $23,884 | $4,496 | $19,388 |
| 2023 | $7,232 | $23,884 | $4,496 | $19,388 |
| 2022 | $7,232 | $15,739 | $3,883 | $11,856 |
| 2021 | $7,022 | $15,739 | $3,883 | $11,856 |
| 2020 | $6,692 | $15,739 | $3,883 | $11,856 |
| 2019 | $6,608 | $16,211 | $3,474 | $12,737 |
| 2018 | $6,424 | $16,211 | $3,474 | $12,737 |
| 2017 | $6,319 | $16,211 | $3,474 | $12,737 |
| 2016 | $5,934 | $14,878 | $3,065 | $11,813 |
| 2015 | $5,693 | $14,878 | $3,065 | $11,813 |
| 2014 | $5,586 | $14,878 | $3,065 | $11,813 |
| 2013 | $5,609 | $16,255 | $3,065 | $13,190 |
Source: Public Records
Map
Nearby Homes
- 3542 191st Place
- 19061 Wentworth Ave
- 19265 Lange St
- 19202 Sherman St
- 3518 S Manor Dr
- 3363 S Manor Dr
- 3320 191st St
- 19121 Roy St
- 3328 193rd St
- 3235 192nd St
- 3235 S Manor Dr Unit 104
- 3240 N Manor Dr Unit 216
- 18747 Sherman St
- 18855 Burnham Ave Unit 234
- 44 Timrick Dr
- 18644 William St
- 18864 Greenbay Ave
- 18634 Bernadine St
- 18 Timrick Dr
- 3034 190th St
- 19150 Wentworth Ave
- 3538 192nd St
- 3543 191st Place
- 19142 Wentworth Ave
- 19140 Wentworth Ave
- 3537 191st Place
- 3532 192nd St
- 3553 192nd St
- 3547 192nd St
- 3531 191st Place
- 19204 Wentworth Ave
- 3541 192nd St
- 3524 192nd St
- 3535 192nd St
- 3525 191st Place
- 19130 Wentworth Ave
- 3534 191st Place
- 3529 192nd St
- 3518 192nd St
- 3604 192nd St
Your Personal Tour Guide
Ask me questions while you tour the home.