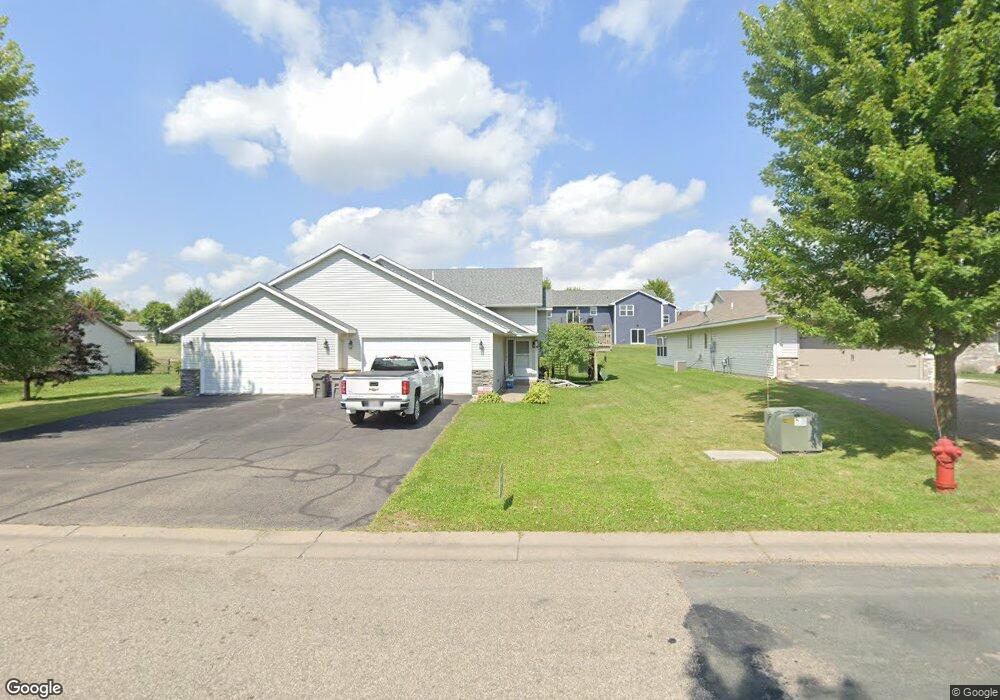
355 Cedar St Unit 29 Baldwin, WI 54002
Estimated Value: $220,000 - $313,000
3
Beds
2
Baths
--
Sq Ft
6,970
Sq Ft Lot
About This Home
This home is located at 355 Cedar St Unit 29, Baldwin, WI 54002 and is currently estimated at $262,317. 355 Cedar St Unit 29 is a home located in St. Croix County with nearby schools including Greenfield Elementary School, Viking Middle School, and Baldwin-Woodville High School.
Ownership History
Date
Name
Owned For
Owner Type
Purchase Details
Closed on
Apr 28, 2017
Sold by
Jackson Shannon D
Bought by
Florez April S
Current Estimated Value
Home Financials for this Owner
Home Financials are based on the most recent Mortgage that was taken out on this home.
Original Mortgage
$132,554
Outstanding Balance
$109,032
Interest Rate
4.14%
Mortgage Type
FHA
Estimated Equity
$153,285
Purchase Details
Closed on
Jul 24, 2015
Sold by
Kusilek Jacob J and Kusilek Carissa M
Bought by
Jackson Shannon D
Home Financials for this Owner
Home Financials are based on the most recent Mortgage that was taken out on this home.
Original Mortgage
$132,050
Interest Rate
4.05%
Mortgage Type
New Conventional
Purchase Details
Closed on
Oct 28, 2009
Sold by
Robbie Construction Inc
Bought by
Kusilek Jacob J and Kusilek Carissa M
Home Financials for this Owner
Home Financials are based on the most recent Mortgage that was taken out on this home.
Original Mortgage
$90,000
Interest Rate
5.07%
Mortgage Type
New Conventional
Create a Home Valuation Report for This Property
The Home Valuation Report is an in-depth analysis detailing your home's value as well as a comparison with similar homes in the area
Home Values in the Area
Average Home Value in this Area
Purchase History
| Date | Buyer | Sale Price | Title Company |
|---|---|---|---|
| Florez April S | $141,300 | Land Title | |
| Jackson Shannon D | $139,000 | St Croix County Abstract & T | |
| Kusilek Jacob J | $100,000 | None Available |
Source: Public Records
Mortgage History
| Date | Status | Borrower | Loan Amount |
|---|---|---|---|
| Open | Florez April S | $132,554 | |
| Previous Owner | Jackson Shannon D | $132,050 | |
| Previous Owner | Kusilek Jacob J | $90,000 |
Source: Public Records
Tax History
| Year | Tax Paid | Tax Assessment Tax Assessment Total Assessment is a certain percentage of the fair market value that is determined by local assessors to be the total taxable value of land and additions on the property. | Land | Improvement |
|---|---|---|---|---|
| 2025 | $3,721 | $184,300 | $19,400 | $164,900 |
| 2024 | $36 | $184,300 | $19,400 | $164,900 |
| 2023 | $3,002 | $184,300 | $19,400 | $164,900 |
| 2022 | $2,959 | $184,300 | $19,400 | $164,900 |
| 2021 | $2,930 | $184,300 | $19,400 | $164,900 |
| 2020 | $2,852 | $128,200 | $14,600 | $113,600 |
| 2019 | $2,777 | $128,200 | $14,600 | $113,600 |
| 2018 | $2,526 | $128,200 | $14,600 | $113,600 |
| 2017 | $2,667 | $128,200 | $14,600 | $113,600 |
| 2016 | $2,667 | $128,200 | $14,600 | $113,600 |
| 2015 | $2,955 | $121,100 | $23,800 | $97,300 |
| 2014 | $2,671 | $121,100 | $23,800 | $97,300 |
| 2013 | $2,554 | $113,800 | $23,800 | $90,000 |
Source: Public Records
Map
Nearby Homes
- 316 Birch St
- 288 Birch St
- 330 Meadowview Ct
- 1724 Redhead Ave
- 300 Cedar St Unit 15
- 1586 Mallard Ave
- 1933 4th Ave
- 310 Willink Dr
- 1621 Mallard Ave
- 1632 Mallard Ave
- 1629 Mallard Ave
- 1617 Mallard Ave
- 370 Creekview Ct
- xxx 11th Ave
- 199 Wood Duck Ln
- 320 Bluebill St
- 233 Pintail St
- 183 Pintail St
- 180 Pintail St
- 195 Pintail St
Your Personal Tour Guide
Ask me questions while you tour the home.