355 Clover Place Durango, CO 81303
Estimated Value: $894,568 - $1,126,000
3
Beds
3
Baths
2,524
Sq Ft
$407/Sq Ft
Est. Value
About This Home
This home is located at 355 Clover Place, Durango, CO 81303 and is currently estimated at $1,028,392, approximately $407 per square foot. 355 Clover Place is a home located in La Plata County with nearby schools including Florida Mesa Elementary School, Escalante Middle School, and Durango High School.
Ownership History
Date
Name
Owned For
Owner Type
Purchase Details
Closed on
Feb 22, 2024
Sold by
Salter Marc Robert and Salter Savra Siverson
Bought by
Salter Living Trust and Salter
Current Estimated Value
Purchase Details
Closed on
Aug 5, 2019
Sold by
Lockwood Frank T and Russell June M
Bought by
Siverson Salter Marc Robert and Siverson Salter Sayra
Home Financials for this Owner
Home Financials are based on the most recent Mortgage that was taken out on this home.
Original Mortgage
$440,000
Interest Rate
3.8%
Mortgage Type
Commercial
Purchase Details
Closed on
Nov 2, 2009
Sold by
Rudolph Victor H and Rudolph Karen W
Bought by
Lockwood Frank T and Russell June M
Home Financials for this Owner
Home Financials are based on the most recent Mortgage that was taken out on this home.
Original Mortgage
$414,500
Interest Rate
4.25%
Mortgage Type
Adjustable Rate Mortgage/ARM
Purchase Details
Closed on
Jul 13, 1993
Bought by
Lockwood Frank T and Russell June M
Create a Home Valuation Report for This Property
The Home Valuation Report is an in-depth analysis detailing your home's value as well as a comparison with similar homes in the area
Purchase History
| Date | Buyer | Sale Price | Title Company |
|---|---|---|---|
| Salter Living Trust | -- | None Listed On Document | |
| Siverson Salter Marc Robert | $550,000 | Land Title Guarantee Co | |
| Lockwood Frank T | $550,000 | Land Title Guarantee Company | |
| Lockwood Frank T | $31,500 | -- |
Source: Public Records
Mortgage History
| Date | Status | Borrower | Loan Amount |
|---|---|---|---|
| Previous Owner | Siverson Salter Marc Robert | $440,000 | |
| Previous Owner | Lockwood Frank T | $414,500 |
Source: Public Records
Tax History
| Year | Tax Paid | Tax Assessment Tax Assessment Total Assessment is a certain percentage of the fair market value that is determined by local assessors to be the total taxable value of land and additions on the property. | Land | Improvement |
|---|---|---|---|---|
| 2025 | $2,809 | $64,520 | $10,970 | $53,550 |
| 2024 | $2,466 | $48,700 | $9,320 | $39,380 |
| 2023 | $2,466 | $51,880 | $9,930 | $41,950 |
| 2022 | $2,287 | $54,340 | $10,400 | $43,940 |
| 2021 | $2,124 | $41,830 | $9,170 | $32,660 |
| 2020 | $1,918 | $38,420 | $9,010 | $29,410 |
| 2019 | $1,855 | $38,420 | $9,010 | $29,410 |
| 2018 | $1,652 | $33,770 | $8,510 | $25,260 |
Source: Public Records
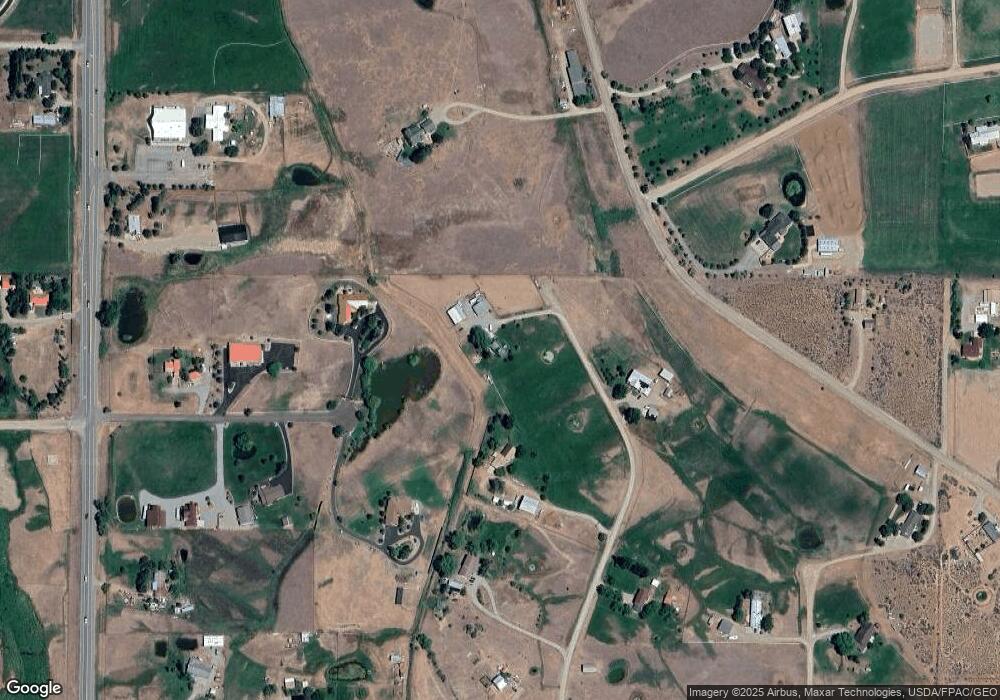
Map
Nearby Homes
- 64 Summer Ln
- 202 Petra Ct
- 208 Petra Ct
- 144 Cielo Way
- 158 Cielo Way
- 154 Cielo Way
- 107 Cielo Way
- 152 Cielo Way
- 113 Cielo Way
- 115 Cielo Way
- 111 Cielo Way
- 109 Cielo Way
- 156 Cielo Way
- 231 Mesa Heights Dr
- 616 Cole Ranch Rd
- 660 County Road 301
- 107 Elevation Dr
- 106 Elevation Dr
- 104 Elevation Dr
- 172 Encantado Ln
- 0 Clover Place
- 299 Clover Place
- 320 Clover Place
- 141 Summer Ln
- 148 Summer Ln
- 201 Clover Place
- 4892 County Road 222
- 120 Summer Ln
- 4831 County Road 222
- 248 Clover Place
- 39 Summer Ln
- 0 Cr 222 Unit 599987
- 0 Cr 222 Unit 600596
- 0 Cr 222 Unit 614958
- 0 Cr 222 Unit 636129
- 0 Cr 222 Unit 643383
- 0 Cr 222 Unit 649249
- 0 Cr 222 Unit 657584
- 0 Cr 222 Unit 2064 County Road 222
- 0 Cr 222 Unit 665819