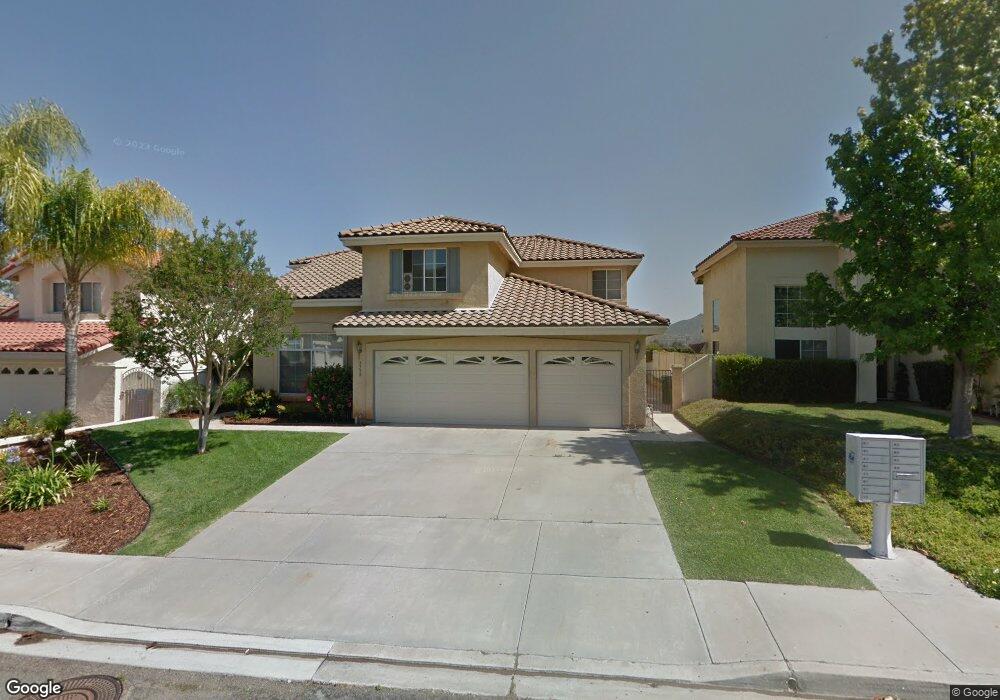
3550 Rancho Diego Cir El Cajon, CA 92019
Estimated Value: $1,284,000 - $1,360,000
4
Beds
3
Baths
2,760
Sq Ft
$478/Sq Ft
Est. Value
About This Home
This home is located at 3550 Rancho Diego Cir, El Cajon, CA 92019 and is currently estimated at $1,317,934, approximately $477 per square foot. 3550 Rancho Diego Cir is a home located in San Diego County with nearby schools including Jamacha Elementary School, Hillsdale Middle School, and Valhalla High.
Ownership History
Date
Name
Owned For
Owner Type
Purchase Details
Closed on
Jan 3, 2017
Sold by
Selfani Charbel and Selfani Olga
Bought by
Jahwary Alaa
Current Estimated Value
Home Financials for this Owner
Home Financials are based on the most recent Mortgage that was taken out on this home.
Original Mortgage
$515,000
Outstanding Balance
$426,570
Interest Rate
4.3%
Mortgage Type
New Conventional
Estimated Equity
$891,364
Purchase Details
Closed on
Dec 29, 2014
Sold by
Bajaj Shant and Bajaj Arti
Bought by
Selfani Charbel and Selfani Olga
Home Financials for this Owner
Home Financials are based on the most recent Mortgage that was taken out on this home.
Original Mortgage
$543,695
Interest Rate
3.75%
Mortgage Type
FHA
Purchase Details
Closed on
Feb 17, 1998
Sold by
Bajaj Shant P
Bought by
Bajaj Family Trust
Purchase Details
Closed on
Dec 22, 1989
Create a Home Valuation Report for This Property
The Home Valuation Report is an in-depth analysis detailing your home's value as well as a comparison with similar homes in the area
Home Values in the Area
Average Home Value in this Area
Purchase History
| Date | Buyer | Sale Price | Title Company |
|---|---|---|---|
| Jahwary Alaa | $700,000 | Corinthian Title Company | |
| Selfani Charbel | $554,000 | Ticor Title San Diego | |
| Bajaj Family Trust | -- | -- | |
| -- | $298,600 | -- |
Source: Public Records
Mortgage History
| Date | Status | Borrower | Loan Amount |
|---|---|---|---|
| Open | Jahwary Alaa | $515,000 | |
| Previous Owner | Selfani Charbel | $543,695 |
Source: Public Records
Tax History Compared to Growth
Tax History
| Year | Tax Paid | Tax Assessment Tax Assessment Total Assessment is a certain percentage of the fair market value that is determined by local assessors to be the total taxable value of land and additions on the property. | Land | Improvement |
|---|---|---|---|---|
| 2025 | $10,193 | $812,402 | $298,369 | $514,033 |
| 2024 | $10,193 | $796,473 | $292,519 | $503,954 |
| 2023 | $9,912 | $780,857 | $286,784 | $494,073 |
| 2022 | $9,735 | $765,547 | $281,161 | $484,386 |
| 2021 | $9,612 | $750,538 | $275,649 | $474,889 |
| 2020 | $9,473 | $742,843 | $272,823 | $470,020 |
| 2019 | $9,348 | $728,278 | $267,474 | $460,804 |
| 2018 | $9,153 | $713,999 | $262,230 | $451,769 |
| 2017 | $7,442 | $573,411 | $210,597 | $362,814 |
| 2016 | $7,131 | $562,168 | $206,468 | $355,700 |
| 2015 | $6,017 | $458,457 | $168,378 | $290,079 |
| 2014 | $5,907 | $449,477 | $165,080 | $284,397 |
Source: Public Records
Map
Nearby Homes
- 3492 Rancho Diego Cir
- 2377 Congressional Dr
- 2458 Sawgrass St
- 3402 Ashley Park Dr
- 3120 Florence Terrace
- 2846 Willow Glen Dr
- 2030 Seca St
- 2552 Wind River Rd
- 3041 Millar Ranch Rd
- 3049 Millar Ranch Rd
- 12319 Via Hacienda
- 1828 Donahue Dr
- 11422 Via Rancho San Diego Unit 84
- 2643 Wind River Rd
- 11683 Via Rancho San Diego
- 11786 Monte View Ct
- 11368 Via Rancho San Diego Unit E
- 12190 Cuyamaca College Dr E Unit 1100
- 12190 Cuyamaca College Dr E Unit 1009
- 2208 Runabout Place
- 3542 Rancho Diego Cir
- 3558 Rancho Diego Cir
- 3534 Rancho Diego Cir
- 3564 Rancho Diego Cir
- 2901 Via Roblar Ct
- 3526 Rancho Diego Cir
- 3572 Rancho Diego Cir
- 2902 Via Roblar Ct
- 3518 Rancho Diego Cir
- 3497 Rancho Diego Cir
- 2953 Via Roblar Ct
- 3580 Rancho Diego Cir
- 2954 Via Roblar Ct
- 3001 Rancho Diego Cir
- 2998 Via Roblar Ct
- 2999 Via Roblar Ct
- 3491 Rancho Diego Cir
- 3510 Rancho Diego Cir
- 3485 Rancho Diego Cir
- 3021 Casmeg Way