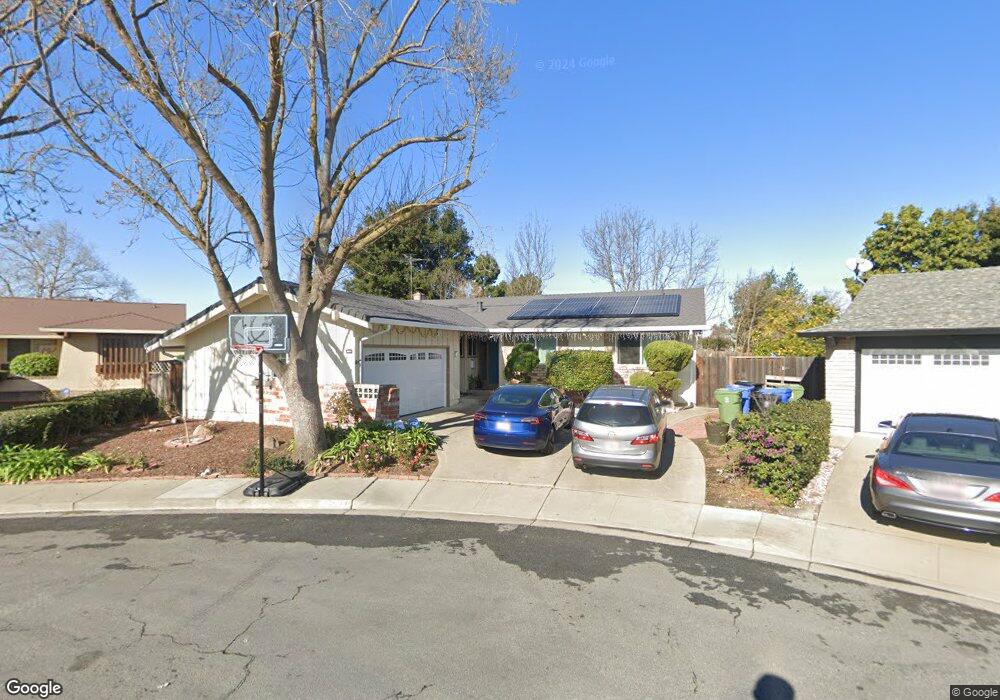
35523 Dee Place Fremont, CA 94536
Brookvale NeighborhoodEstimated Value: $1,567,000 - $1,996,000
3
Beds
2
Baths
1,853
Sq Ft
$981/Sq Ft
Est. Value
About This Home
This home is located at 35523 Dee Place, Fremont, CA 94536 and is currently estimated at $1,816,997, approximately $980 per square foot. 35523 Dee Place is a home located in Alameda County with nearby schools including Brookvale Elementary School, Thornton Middle School, and American High School.
Ownership History
Date
Name
Owned For
Owner Type
Purchase Details
Closed on
Mar 17, 2021
Sold by
Koneru Roopa and Meka Ravi Kiran
Bought by
Meka Ravi Kiran and Koneru Roopa
Current Estimated Value
Purchase Details
Closed on
Jun 4, 2018
Sold by
Pardorla Rodolfo and Lorenz Nannette M
Bought by
Meka Ravi Kiran and Koneru Roopa
Home Financials for this Owner
Home Financials are based on the most recent Mortgage that was taken out on this home.
Original Mortgage
$960,800
Outstanding Balance
$816,382
Interest Rate
3.75%
Mortgage Type
Adjustable Rate Mortgage/ARM
Estimated Equity
$1,000,615
Purchase Details
Closed on
Jul 10, 2000
Sold by
Gilchrist James P and Gilchrist Donna J
Bought by
Pardorla Rodolfo and Lorenz Nannette M
Home Financials for this Owner
Home Financials are based on the most recent Mortgage that was taken out on this home.
Original Mortgage
$359,200
Interest Rate
8.12%
Create a Home Valuation Report for This Property
The Home Valuation Report is an in-depth analysis detailing your home's value as well as a comparison with similar homes in the area
Home Values in the Area
Average Home Value in this Area
Purchase History
| Date | Buyer | Sale Price | Title Company |
|---|---|---|---|
| Meka Ravi Kiran | -- | None Available | |
| Meka Ravi Kiran | $1,201,000 | North American Title Company | |
| Pardorla Rodolfo | $449,000 | American Title Co |
Source: Public Records
Mortgage History
| Date | Status | Borrower | Loan Amount |
|---|---|---|---|
| Open | Meka Ravi Kiran | $960,800 | |
| Previous Owner | Pardorla Rodolfo | $359,200 |
Source: Public Records
Tax History Compared to Growth
Tax History
| Year | Tax Paid | Tax Assessment Tax Assessment Total Assessment is a certain percentage of the fair market value that is determined by local assessors to be the total taxable value of land and additions on the property. | Land | Improvement |
|---|---|---|---|---|
| 2025 | $15,997 | $1,366,509 | $455,124 | $911,385 |
| 2024 | $15,997 | $1,339,715 | $446,200 | $893,515 |
| 2023 | $15,583 | $1,313,449 | $437,452 | $875,997 |
| 2022 | $15,403 | $1,287,700 | $428,876 | $858,824 |
| 2021 | $15,021 | $1,262,455 | $420,468 | $841,987 |
| 2020 | $15,129 | $1,249,520 | $416,160 | $833,360 |
| 2019 | $14,954 | $1,225,020 | $408,000 | $817,020 |
| 2018 | $7,485 | $594,583 | $178,375 | $416,208 |
| 2017 | $7,298 | $582,927 | $174,878 | $408,049 |
| 2016 | $7,169 | $571,500 | $171,450 | $400,050 |
| 2015 | $7,071 | $562,920 | $168,876 | $394,044 |
| 2014 | $6,946 | $551,897 | $165,569 | $386,328 |
Source: Public Records
Map
Nearby Homes
- 3184 Waugh Place
- 35415 Woodbridge Place
- 34926 Moina Shaiq Common
- 3155 Mackenzie Place
- 3134 Warwick Rd
- 4027 Sunset Terrace
- 34926 Osprey Dr
- 2224 Peacock Place Unit 3
- 34917 Sea Cliff Terrace
- 3751 Ruskin Place
- 2421 Maraschino Place
- 2404 Maraschino Place
- 35560 Monterra Terrace Unit 301
- 34233 Atteridge Place
- 4015 Clydesdale Common
- 34179 Bowling Green Common
- 3371 Baywood Terrace Unit 214
- 34552 Nantucket Common
- 34512 Nantucket Common
- 1157 Silver St
- 35531 Dee Place
- 35515 Dee Place
- 35539 Dee Place
- 35522 Dee Place
- 35506 Dante Place
- 35544 Dee Place
- 35547 Dee Place
- 35510 Dante Place
- 35540 Dee Place
- 35500 Dante Place
- 35555 Dee Place
- 35554 Dee Place
- 35516 Dante Place
- 35526 Dante Place
- 3145 Dee Ct
- 35563 Dee Place
- 35572 Dee Place
- 3135 Dee Ct
- 35501 Dante Place
- 35542 Dante Place