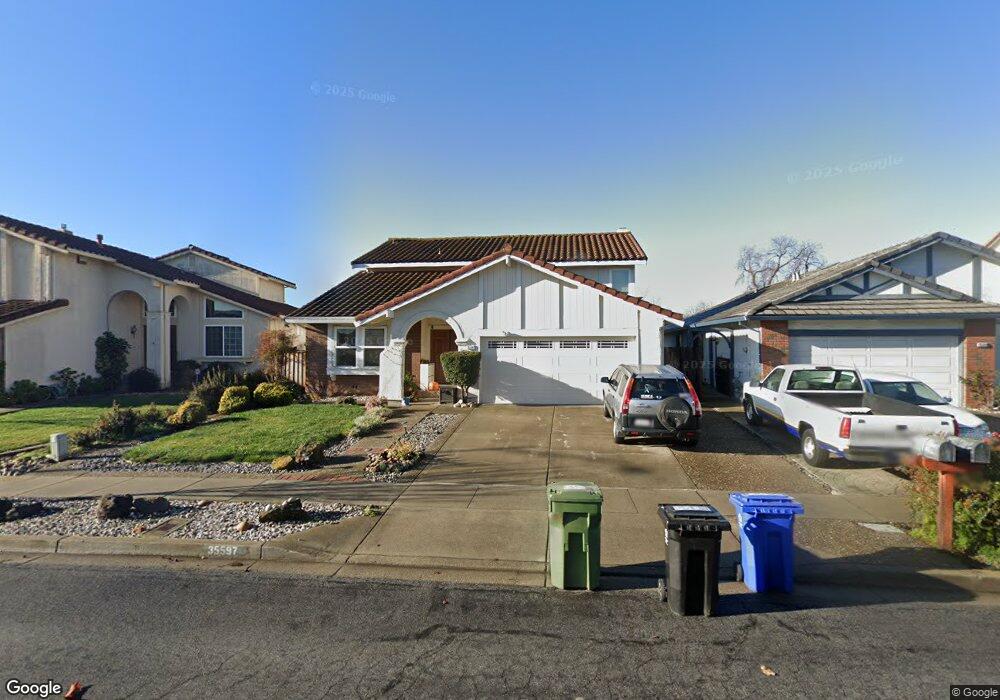
35597 Conovan Ln Fremont, CA 94536
Brookvale NeighborhoodEstimated Value: $2,060,000 - $2,674,000
4
Beds
3
Baths
2,528
Sq Ft
$928/Sq Ft
Est. Value
About This Home
This home is located at 35597 Conovan Ln, Fremont, CA 94536 and is currently estimated at $2,345,044, approximately $927 per square foot. 35597 Conovan Ln is a home located in Alameda County with nearby schools including Brookvale Elementary School, Thornton Middle School, and American High School.
Ownership History
Date
Name
Owned For
Owner Type
Purchase Details
Closed on
May 26, 2015
Sold by
Lintao Quiliano T and Lintao Gloria V
Bought by
Guo Xingting and Sun Qi
Current Estimated Value
Home Financials for this Owner
Home Financials are based on the most recent Mortgage that was taken out on this home.
Original Mortgage
$968,250
Outstanding Balance
$732,689
Interest Rate
3.12%
Mortgage Type
Adjustable Rate Mortgage/ARM
Estimated Equity
$1,612,355
Purchase Details
Closed on
Mar 28, 2012
Sold by
Lintao Quiliano T and Lintao Gloria V
Bought by
Lintao Quillano T and Lintao Gloria V
Home Financials for this Owner
Home Financials are based on the most recent Mortgage that was taken out on this home.
Original Mortgage
$390,000
Interest Rate
3%
Mortgage Type
New Conventional
Purchase Details
Closed on
Oct 29, 2003
Sold by
Lintao Quiliano T and Lintao Gloria V
Bought by
Lintao Quiliano T and Lintao Gloria V
Create a Home Valuation Report for This Property
The Home Valuation Report is an in-depth analysis detailing your home's value as well as a comparison with similar homes in the area
Home Values in the Area
Average Home Value in this Area
Purchase History
| Date | Buyer | Sale Price | Title Company |
|---|---|---|---|
| Guo Xingting | $1,291,000 | First American Title Company | |
| Lintao Quillano T | -- | North American Title Company | |
| Lintao Quiliano T | -- | North American Title Company | |
| Lintao Quiliano T | -- | -- | |
| Lintao Quiliano T | -- | -- |
Source: Public Records
Mortgage History
| Date | Status | Borrower | Loan Amount |
|---|---|---|---|
| Open | Guo Xingting | $968,250 | |
| Previous Owner | Lintao Quiliano T | $390,000 |
Source: Public Records
Tax History Compared to Growth
Tax History
| Year | Tax Paid | Tax Assessment Tax Assessment Total Assessment is a certain percentage of the fair market value that is determined by local assessors to be the total taxable value of land and additions on the property. | Land | Improvement |
|---|---|---|---|---|
| 2025 | $17,972 | $1,544,536 | $558,841 | $992,695 |
| 2024 | $17,972 | $1,514,120 | $547,886 | $973,234 |
| 2023 | $17,509 | $1,491,297 | $537,144 | $954,153 |
| 2022 | $17,309 | $1,455,057 | $526,612 | $935,445 |
| 2021 | $16,877 | $1,426,396 | $516,289 | $917,107 |
| 2020 | $17,012 | $1,418,704 | $510,997 | $907,707 |
| 2019 | $16,813 | $1,390,896 | $500,981 | $889,915 |
| 2018 | $16,488 | $1,363,630 | $491,160 | $872,470 |
| 2017 | $16,075 | $1,336,894 | $481,530 | $855,364 |
| 2016 | $15,815 | $1,310,687 | $472,091 | $838,596 |
| 2015 | $4,510 | $337,848 | $61,519 | $276,329 |
| 2014 | $4,428 | $331,231 | $60,314 | $270,917 |
Source: Public Records
Map
Nearby Homes
- 3100 Mackenzie Place
- 34915 Osprey Dr
- 34981 Skylark Dr
- 34915 Skylark Dr
- 2224 Peacock Place Unit 3
- 34926 Moina Shaiq Common
- 2221 Partridge Way Unit 3
- 2139 Canary Ct Unit 2
- 35990 Copper St
- 1889 Flagstone Dr
- 35563 Linda Dr
- 35624 Mccarty Common
- 2404 Maraschino Place
- 36992 Meadowbrook Common Unit 102
- 3371 Baywood Terrace Unit 214
- 457 Calistoga Cir
- 409 King Ave
- 35849 Linda Dr
- 35784 Linda Dr
- 3402 Pinewood Terrace Unit 211
- 35589 Conovan Ln
- 35603 Conovan Ln
- 35581 Conovan Ln
- 35611 Conovan Ln
- 35604 Runckel Ln
- 35616 Runckel Ln
- 35575 Conovan Ln
- 35623 Conovan Ln
- 35628 Runckel Ln
- 35602 Conovan Ln
- 35596 Conovan Ln
- 35614 Conovan Ln
- 35584 Conovan Ln
- 35627 Conovan Ln
- 35632 Runckel Ln
- 35622 Conovan Ln
- 35628 Conovan Ln
- 35635 Conovan Ln
- 35644 Runckel Ln
- 2758 Dominici Dr