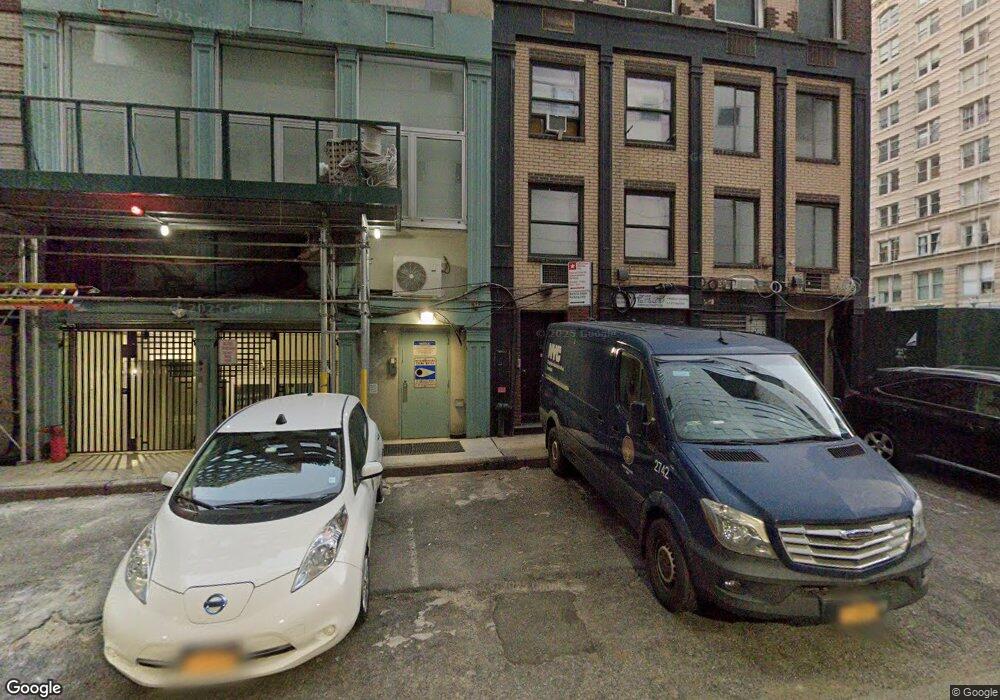
356 Broadway Unit 2D New York, NY 10013
Tribeca NeighborhoodEstimated Value: $1,573,469 - $2,003,000
1
Bed
--
Bath
1,409
Sq Ft
$1,264/Sq Ft
Est. Value
About This Home
This home is located at 356 Broadway Unit 2D, New York, NY 10013 and is currently estimated at $1,780,867, approximately $1,263 per square foot. 356 Broadway Unit 2D is a home located in New York County with nearby schools including P.S. 397 Spruce Street School, Lower Manhattan Community Middle School, and Clinton School.
Ownership History
Date
Name
Owned For
Owner Type
Purchase Details
Closed on
Apr 2, 2010
Sold by
Dana E Garner Executor Of Estate Of Da
Bought by
Shangri-La Associates Llc
Current Estimated Value
Purchase Details
Closed on
Mar 18, 2010
Sold by
Estate Of David Bosco and % Ethel J Griffin Public Administrato
Bought by
Dana E Garner Executor and Estate Of David Bosco
Purchase Details
Closed on
Dec 10, 2008
Sold by
Bosco Emily D'Arcy
Bought by
Estate Of David Bosco and Ethel J Griffin Public Administrator
Purchase Details
Closed on
Apr 28, 2008
Sold by
David Bosco and David Emily D'Arcy
Bought by
Bosco Emily D'Arcy
Purchase Details
Closed on
May 23, 1996
Sold by
Bosco Bettie A
Bought by
Bosco David J
Create a Home Valuation Report for This Property
The Home Valuation Report is an in-depth analysis detailing your home's value as well as a comparison with similar homes in the area
Home Values in the Area
Average Home Value in this Area
Purchase History
| Date | Buyer | Sale Price | Title Company |
|---|---|---|---|
| Shangri-La Associates Llc | $660,000 | -- | |
| Shangri-La Associates Llc | $660,000 | -- | |
| Dana E Garner Executor | -- | -- | |
| Dana E Garner Executor | -- | -- | |
| Estate Of David Bosco | -- | -- | |
| Estate Of David Bosco | -- | -- | |
| Bosco Emily D'Arcy | -- | -- | |
| Bosco Emily D'Arcy | -- | -- | |
| Bosco David J | -- | -- | |
| Bosco David J | -- | -- |
Source: Public Records
Tax History Compared to Growth
Tax History
| Year | Tax Paid | Tax Assessment Tax Assessment Total Assessment is a certain percentage of the fair market value that is determined by local assessors to be the total taxable value of land and additions on the property. | Land | Improvement |
|---|---|---|---|---|
| 2025 | $13,834 | $113,263 | $10,941 | $102,322 |
| 2024 | $13,834 | $110,658 | $10,941 | $99,717 |
| 2023 | $13,243 | $107,960 | $10,941 | $97,019 |
| 2022 | $12,218 | $99,863 | $10,941 | $88,922 |
| 2021 | $12,250 | $99,863 | $10,941 | $88,922 |
| 2020 | $12,564 | $110,626 | $10,941 | $99,685 |
| 2019 | $12,152 | $108,132 | $10,941 | $97,191 |
| 2018 | $11,443 | $104,349 | $10,942 | $93,407 |
| 2017 | $10,551 | $89,171 | $10,941 | $78,230 |
| 2016 | $9,930 | $91,372 | $10,941 | $80,431 |
| 2015 | $4,639 | $88,750 | $10,941 | $77,809 |
| 2014 | $4,639 | $76,213 | $10,941 | $65,272 |
Source: Public Records
Map
Nearby Homes
- 101 Leonard St Unit 2E
- 101 Leonard St Unit 9D
- 101 Leonard St Unit 4A
- 101 Leonard St Unit 9A
- 354 Broadway Unit 8
- 354 Broadway Unit 4
- 356 Broadway Unit 4B
- 108 Leonard St Unit 4K
- 108 Leonard St Unit 4N
- 108 Leonard St Unit 7G
- 108 Leonard St Unit 12F
- 108 Leonard St Unit 2E
- 108 Leonard St Unit 12 K
- 108 Leonard St Unit 12N
- 108 Leonard St Unit 3K
- 108 Leonard St Unit 7H
- 108 Leonard St Unit 15A
- 108 Leonard St Unit 12 R
- 108 Leonard St Unit 10 C
- 108 Leonard St Unit PH 15 B
- 356 Broadway Unit 4D
- 356 Broadway Unit 5D
- 356 Broadway Unit 5C
- 356 Broadway Unit 5B
- 356 Broadway Unit 5A
- 356 Broadway Unit 4C
- 356 Broadway Unit 4A
- 356 Broadway Unit 3D
- 356 Broadway Unit 3C
- 356 Broadway Unit 3B
- 356 Broadway Unit 3A
- 356 Broadway Unit 2C
- 356 Broadway Unit 2B
- 356 Broadway Unit 2A
- 356 Broadway Unit 1A
- 356 Broadway
- 356 Broadway Unit C1
- 356 Broadway Unit LL
- 356 Broadway Unit 5APH
- 356 Broadway Unit PH-5A