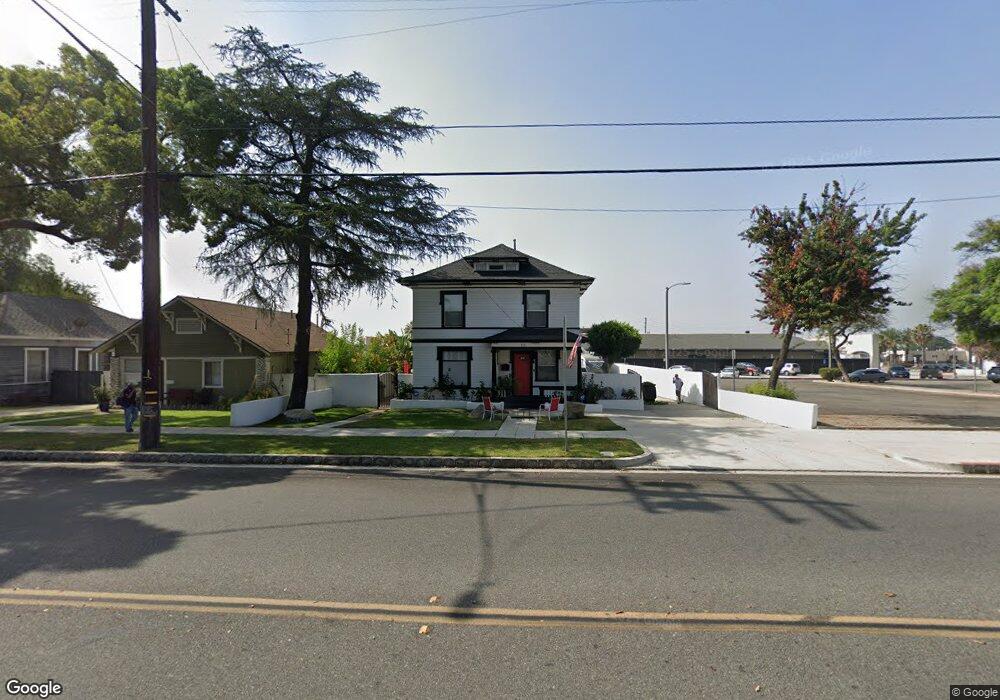
356 E 9th St Upland, CA 91786
Estimated Value: $459,539 - $680,000
5
Beds
2
Baths
1,764
Sq Ft
$323/Sq Ft
Est. Value
About This Home
This home is located at 356 E 9th St, Upland, CA 91786 and is currently estimated at $569,770, approximately $322 per square foot. 356 E 9th St is a home located in San Bernardino County with nearby schools including Upland Elementary School, Upland Junior High School, and Upland High School.
Ownership History
Date
Name
Owned For
Owner Type
Purchase Details
Closed on
Mar 12, 2015
Sold by
Strabley Robert L
Bought by
Strabley Robert L
Current Estimated Value
Purchase Details
Closed on
Dec 29, 2010
Sold by
Cobb Michael A
Bought by
Strabley Robert L and Cobb Joshua M
Home Financials for this Owner
Home Financials are based on the most recent Mortgage that was taken out on this home.
Original Mortgage
$39,000
Outstanding Balance
$26,140
Interest Rate
4.43%
Mortgage Type
Seller Take Back
Estimated Equity
$543,630
Purchase Details
Closed on
Apr 14, 2003
Sold by
Cobb Michael A
Bought by
Cobb Michael A and Cobb Kathleen Sue
Home Financials for this Owner
Home Financials are based on the most recent Mortgage that was taken out on this home.
Original Mortgage
$150,000
Interest Rate
5.54%
Mortgage Type
Credit Line Revolving
Create a Home Valuation Report for This Property
The Home Valuation Report is an in-depth analysis detailing your home's value as well as a comparison with similar homes in the area
Home Values in the Area
Average Home Value in this Area
Purchase History
| Date | Buyer | Sale Price | Title Company |
|---|---|---|---|
| Strabley Robert L | -- | None Available | |
| Strabley Robert L | $139,000 | Ticor Title Company | |
| Cobb Michael A | -- | National Title Service |
Source: Public Records
Mortgage History
| Date | Status | Borrower | Loan Amount |
|---|---|---|---|
| Open | Strabley Robert L | $39,000 | |
| Previous Owner | Cobb Michael A | $150,000 |
Source: Public Records
Tax History
| Year | Tax Paid | Tax Assessment Tax Assessment Total Assessment is a certain percentage of the fair market value that is determined by local assessors to be the total taxable value of land and additions on the property. | Land | Improvement |
|---|---|---|---|---|
| 2025 | $3,070 | $266,864 | $102,649 | $164,215 |
| 2024 | $2,973 | $261,631 | $100,636 | $160,995 |
| 2023 | $2,927 | $256,501 | $98,663 | $157,838 |
| 2022 | $2,864 | $251,471 | $96,728 | $154,743 |
| 2021 | $2,858 | $246,540 | $94,831 | $151,709 |
| 2020 | $2,780 | $244,012 | $93,859 | $150,153 |
| 2019 | $2,772 | $239,228 | $92,019 | $147,209 |
| 2018 | $2,706 | $234,538 | $90,215 | $144,323 |
| 2017 | $2,628 | $229,939 | $88,446 | $141,493 |
| 2016 | $2,438 | $225,431 | $86,712 | $138,719 |
| 2015 | $1,925 | $179,089 | $77,818 | $101,271 |
| 2014 | $1,875 | $175,581 | $76,294 | $99,287 |
Source: Public Records
Map
Nearby Homes
Your Personal Tour Guide
Ask me questions while you tour the home.