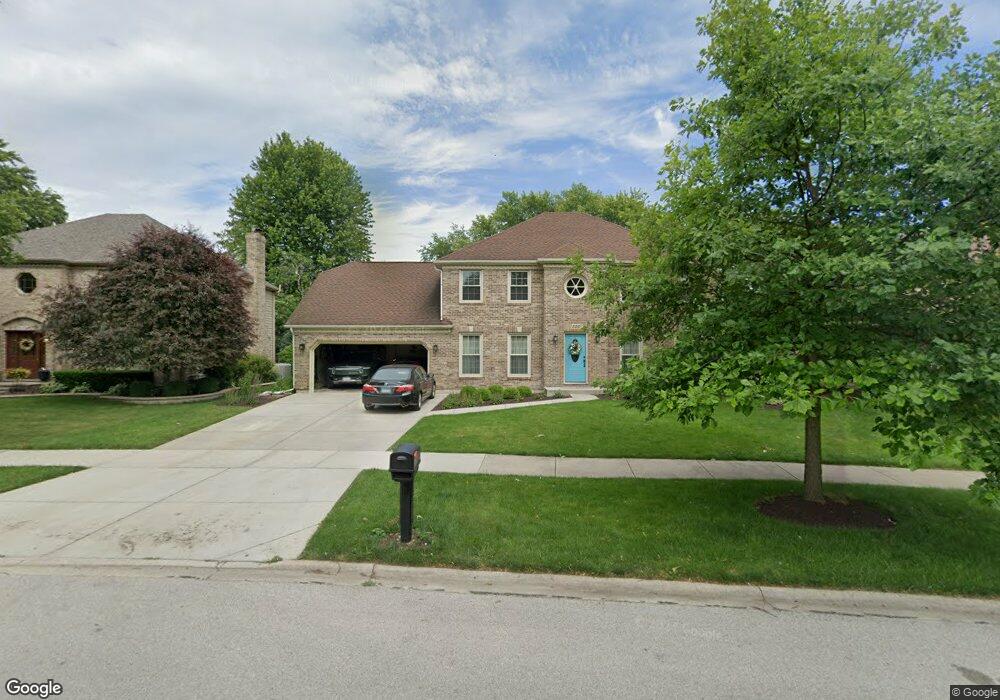
356 Prairie Knoll Dr Naperville, IL 60565
Winding Creek Estates NeighborhoodEstimated Value: $815,169 - $848,000
--
Bed
1
Bath
2,940
Sq Ft
$283/Sq Ft
Est. Value
About This Home
This home is located at 356 Prairie Knoll Dr, Naperville, IL 60565 and is currently estimated at $832,792, approximately $283 per square foot. 356 Prairie Knoll Dr is a home located in DuPage County with nearby schools including Maplebrook Elementary School, Lincoln Jr. High School, and Naperville Central High School.
Ownership History
Date
Name
Owned For
Owner Type
Purchase Details
Closed on
Feb 6, 2013
Sold by
Quigley Cheryl M and Goulding Cheryl M
Bought by
Goulding John D and Goulding Cheryl M
Current Estimated Value
Home Financials for this Owner
Home Financials are based on the most recent Mortgage that was taken out on this home.
Original Mortgage
$289,000
Outstanding Balance
$200,526
Interest Rate
3.25%
Mortgage Type
New Conventional
Estimated Equity
$632,266
Purchase Details
Closed on
Jul 31, 2000
Sold by
Mcgowan William A and Mcgowan Leslie N
Bought by
Quigley Cheryl M
Home Financials for this Owner
Home Financials are based on the most recent Mortgage that was taken out on this home.
Original Mortgage
$302,000
Interest Rate
8%
Create a Home Valuation Report for This Property
The Home Valuation Report is an in-depth analysis detailing your home's value as well as a comparison with similar homes in the area
Home Values in the Area
Average Home Value in this Area
Purchase History
| Date | Buyer | Sale Price | Title Company |
|---|---|---|---|
| Goulding John D | -- | None Available | |
| Quigley Cheryl M | $377,500 | -- |
Source: Public Records
Mortgage History
| Date | Status | Borrower | Loan Amount |
|---|---|---|---|
| Open | Goulding John D | $289,000 | |
| Closed | Quigley Cheryl M | $302,000 |
Source: Public Records
Tax History Compared to Growth
Tax History
| Year | Tax Paid | Tax Assessment Tax Assessment Total Assessment is a certain percentage of the fair market value that is determined by local assessors to be the total taxable value of land and additions on the property. | Land | Improvement |
|---|---|---|---|---|
| 2024 | $13,188 | $223,271 | $78,595 | $144,676 |
| 2023 | $12,721 | $203,770 | $71,730 | $132,040 |
| 2022 | $11,661 | $186,180 | $65,540 | $120,640 |
| 2021 | $11,239 | $179,140 | $63,060 | $116,080 |
| 2020 | $11,000 | $175,920 | $61,930 | $113,990 |
| 2019 | $10,683 | $168,310 | $59,250 | $109,060 |
| 2018 | $10,687 | $168,310 | $59,250 | $109,060 |
| 2017 | $10,474 | $162,630 | $57,250 | $105,380 |
| 2016 | $10,268 | $156,750 | $55,180 | $101,570 |
| 2015 | $10,208 | $147,610 | $51,960 | $95,650 |
| 2014 | $10,325 | $144,710 | $50,940 | $93,770 |
| 2013 | $10,169 | $145,060 | $51,060 | $94,000 |
Source: Public Records
Map
Nearby Homes
- 1921 Wisteria Ct Unit 3
- 35 Foxcroft Rd Unit 123
- 47 Glencoe Ct Unit 102D
- 1751 S Washington St Unit 1
- 2132 Berkley Ct Unit 201A
- 2167 Countryside Cir
- 23 Glencoe Ct Unit 202B
- 1443 Meander Dr
- 302 Carriage Hill Rd
- 2337 Worthing Dr Unit 102A
- 138 E Bailey Rd Unit M
- 128 E Bailey Rd Unit G
- 158 E Bailey Rd Unit F
- 312 Leeds Ct
- 1537 Lighthouse Dr
- 336 Brooklea Ct
- 517 Sheffield Rd
- 344 Waxwing Ave
- 2279 Kaskaskia Ct
- 1408 Swallow St
- 352 Prairie Knoll Dr
- 360 Prairie Knoll Dr
- 1813 Clyde Dr
- 1809 Clyde Dr
- 364 Prairie Knoll Dr
- 348 Prairie Knoll Dr
- 1805 Clyde Dr
- 1817 Clyde Dr
- 359 Prairie Knoll Dr
- 1821 Clyde Dr
- 349 Prairie Knoll Dr
- 1757 Clyde Dr
- 344 Prairie Knoll Dr
- 353 Prairie Knoll Dr
- 368 Prairie Knoll Dr
- 1825 Clyde Dr
- 373 Prairie Knoll Dr
- 345 Prairie Knoll Dr
- 1753 Clyde Dr
- 340 Prairie Knoll Dr