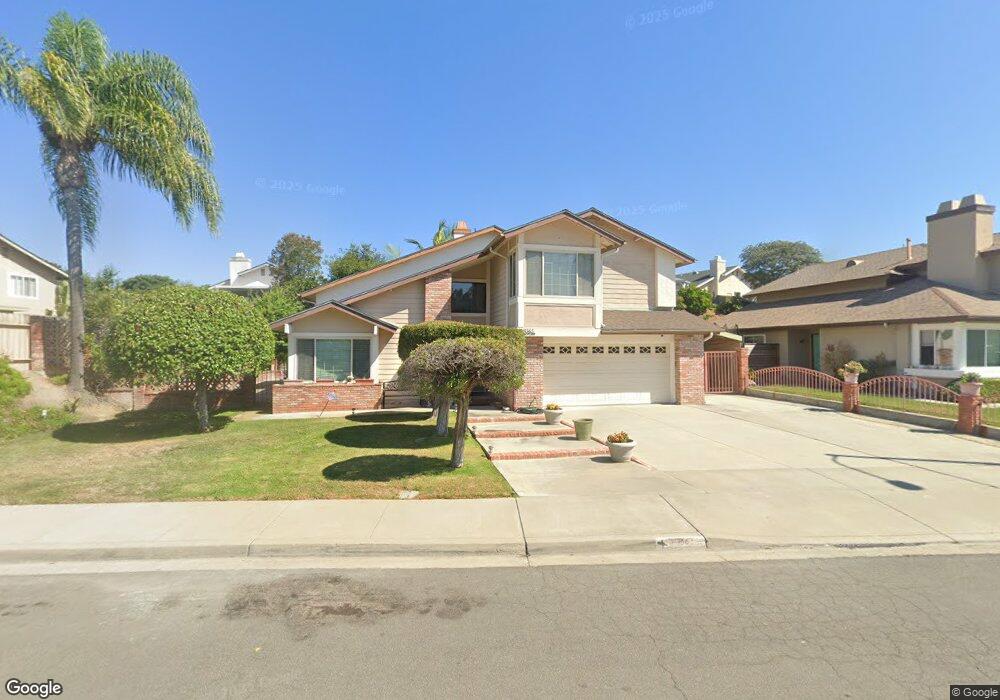
3565 Normount Rd Oceanside, CA 92056
Ocean Hills NeighborhoodEstimated Value: $1,055,000 - $1,188,000
4
Beds
3
Baths
2,203
Sq Ft
$502/Sq Ft
Est. Value
About This Home
This home is located at 3565 Normount Rd, Oceanside, CA 92056 and is currently estimated at $1,104,986, approximately $501 per square foot. 3565 Normount Rd is a home located in San Diego County with nearby schools including Lake Elementary School, Madison Middle School, and Rancho Buena Vista High School.
Ownership History
Date
Name
Owned For
Owner Type
Purchase Details
Closed on
Jul 17, 2012
Sold by
Davis Emma V P
Bought by
Davis Emma V P
Current Estimated Value
Home Financials for this Owner
Home Financials are based on the most recent Mortgage that was taken out on this home.
Original Mortgage
$105,000
Outstanding Balance
$15,840
Interest Rate
3.36%
Mortgage Type
New Conventional
Estimated Equity
$1,089,146
Purchase Details
Closed on
Mar 8, 2005
Sold by
Davis Emma V P
Bought by
Davis Emma V P
Purchase Details
Closed on
Feb 1, 2000
Sold by
Davis Emma
Bought by
Davis Thomas
Purchase Details
Closed on
Jan 31, 2000
Sold by
Juarez Miguel Angel Gutierrez and Juarez Carmen Gutierrez
Bought by
Davis Thomas
Purchase Details
Closed on
Dec 29, 1983
Create a Home Valuation Report for This Property
The Home Valuation Report is an in-depth analysis detailing your home's value as well as a comparison with similar homes in the area
Home Values in the Area
Average Home Value in this Area
Purchase History
| Date | Buyer | Sale Price | Title Company |
|---|---|---|---|
| Davis Emma V P | -- | Stewart Title Of California | |
| Davis Emma V P | -- | Stewart Title Of California | |
| Davis Emma V P | -- | -- | |
| Davis Thomas | -- | American Title Co | |
| Davis Thomas | $66,000 | Fidelity National Title Co | |
| -- | $140,000 | -- |
Source: Public Records
Mortgage History
| Date | Status | Borrower | Loan Amount |
|---|---|---|---|
| Open | Davis Emma V P | $105,000 |
Source: Public Records
Tax History
| Year | Tax Paid | Tax Assessment Tax Assessment Total Assessment is a certain percentage of the fair market value that is determined by local assessors to be the total taxable value of land and additions on the property. | Land | Improvement |
|---|---|---|---|---|
| 2025 | $3,202 | $298,145 | $82,847 | $215,298 |
| 2024 | $3,202 | $292,300 | $81,223 | $211,077 |
| 2023 | $3,125 | $286,570 | $79,631 | $206,939 |
| 2022 | $3,116 | $280,952 | $78,070 | $202,882 |
| 2021 | $3,046 | $275,444 | $76,540 | $198,904 |
| 2020 | $3,035 | $272,621 | $75,756 | $196,865 |
| 2019 | $2,990 | $267,276 | $74,271 | $193,005 |
| 2018 | $2,844 | $262,036 | $72,815 | $189,221 |
| 2017 | $2,791 | $256,899 | $71,388 | $185,511 |
| 2016 | $2,725 | $251,863 | $69,989 | $181,874 |
| 2015 | $2,713 | $248,081 | $68,938 | $179,143 |
| 2014 | $2,647 | $243,222 | $67,588 | $175,634 |
Source: Public Records
Map
Nearby Homes
- 1603 Laurelwood Way
- 4912 Colusa Dr
- 1522 Sunset Dr
- 3643 Merced Dr
- 4566 Hancock Cir
- 0 Hedionda Ave
- 3563 Turquoise Ln
- 4470 Sapphire Ln
- 4528 Cordoba Way
- 157 Horizon Ln
- 120 Brookside Ln
- 101 Havenview Ln
- 65 Brookside Ln
- 42 Havenview Ln
- 4359 Serena Ave
- 1863 Sunset Dr
- 1937 Sunset Dr
- 1192 Via Santa Paulo
- 601 Marazon Ln
- 5155 Via Seville
- 3563 Normount Rd
- 4642 Waverly Rd
- 3594 Newland Rd
- 3596 Newland Rd
- 3561 Normount Rd
- 3592 Newland Rd
- 3562 Normount Rd
- 3564 Normount Rd
- 3559 Normount Rd
- 3560 Normount Rd
- 3590 Newland Rd
- 3566 Normount Rd
- 3593 Normount Rd
- 3558 Normount Rd
- 3557 Normount Rd
- 4626 Waverly Rd
- 4627 Waverly Rd
- 4641 Wickley Place
- 3588 Newland Rd
- 4643 Wickley Place
Your Personal Tour Guide
Ask me questions while you tour the home.