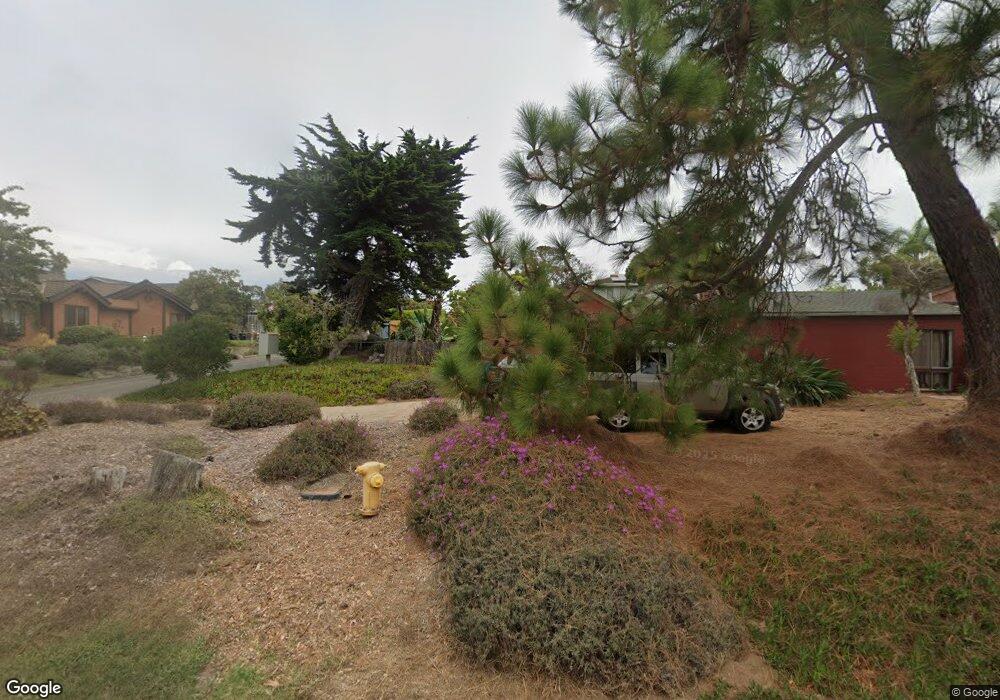
357 Ocean View Ave Encinitas, CA 92024
Central Encinitas NeighborhoodEstimated Value: $1,898,000 - $2,504,000
3
Beds
2
Baths
1,895
Sq Ft
$1,144/Sq Ft
Est. Value
About This Home
This home is located at 357 Ocean View Ave, Encinitas, CA 92024 and is currently estimated at $2,167,530, approximately $1,143 per square foot. 357 Ocean View Ave is a home located in San Diego County with nearby schools including Paul Ecke-Central Elementary, Diegueno Middle School, and La Costa Canyon High School.
Ownership History
Date
Name
Owned For
Owner Type
Purchase Details
Closed on
Feb 7, 2000
Sold by
Wachsman William and Remba Matilda
Bought by
Dongre Summit
Current Estimated Value
Home Financials for this Owner
Home Financials are based on the most recent Mortgage that was taken out on this home.
Original Mortgage
$391,200
Outstanding Balance
$126,580
Interest Rate
7.87%
Estimated Equity
$2,040,950
Purchase Details
Closed on
Jun 25, 1994
Sold by
Wachsman William
Bought by
Wachsman William and Remba Matilda
Home Financials for this Owner
Home Financials are based on the most recent Mortgage that was taken out on this home.
Original Mortgage
$263,500
Interest Rate
5.87%
Purchase Details
Closed on
Nov 3, 1989
Purchase Details
Closed on
Oct 1, 1985
Create a Home Valuation Report for This Property
The Home Valuation Report is an in-depth analysis detailing your home's value as well as a comparison with similar homes in the area
Home Values in the Area
Average Home Value in this Area
Purchase History
| Date | Buyer | Sale Price | Title Company |
|---|---|---|---|
| Dongre Summit | $489,000 | Southland Title | |
| Wachsman William | -- | First American Title Ins Co | |
| -- | $345,000 | -- | |
| -- | $210,000 | -- |
Source: Public Records
Mortgage History
| Date | Status | Borrower | Loan Amount |
|---|---|---|---|
| Open | Dongre Summit | $391,200 | |
| Previous Owner | Wachsman William | $263,500 |
Source: Public Records
Tax History
| Year | Tax Paid | Tax Assessment Tax Assessment Total Assessment is a certain percentage of the fair market value that is determined by local assessors to be the total taxable value of land and additions on the property. | Land | Improvement |
|---|---|---|---|---|
| 2025 | $8,139 | $751,562 | $428,809 | $322,753 |
| 2024 | $8,139 | $736,826 | $420,401 | $316,425 |
| 2023 | $7,930 | $722,379 | $412,158 | $310,221 |
| 2022 | $7,657 | $708,216 | $404,077 | $304,139 |
| 2021 | $7,729 | $694,330 | $396,154 | $298,176 |
| 2020 | $7,638 | $687,211 | $392,092 | $295,119 |
| 2019 | $7,485 | $673,737 | $384,404 | $289,333 |
| 2018 | $7,382 | $660,527 | $376,867 | $283,660 |
| 2017 | $7,256 | $647,577 | $369,478 | $278,099 |
| 2016 | $6,988 | $634,881 | $362,234 | $272,647 |
| 2015 | $6,907 | $625,345 | $356,793 | $268,552 |
| 2014 | $6,824 | $613,096 | $349,804 | $263,292 |
Source: Public Records
Map
Nearby Homes
- 215 N Vulcan Ave
- 370 Carmel Creeper Place Unit 8
- 537 Sweet Pea Place
- 90 N Coast Highway 101 Unit 310
- 90 N Coast Highway 101
- 103 Mangano Cir
- 201 4th St Unit A & B
- 614 Ocean View Ave
- 526 Saxony Rd
- 200 Neptune Ave Unit 2
- 100 5th St
- 231 5th St
- 523 N Vulcan Ave Unit SPC 24A
- 523 N Vulcan Ave Unit 3
- 523 N Vulcan Ave Unit 41
- 523 N Vulcan Ave Unit 43
- 553 Hygeia Ave
- 697 Ocean View Ave
- 630 Poinsettia Park N
- 554 & 556 Stratford Dr
- 359 Ocean View Ave
- 353 Ocean View Ave
- 369 Ocean View Ave
- 370 Calle de Adele
- 349 1/2 Ocean View Ave
- 349 Ocean View Ave
- 361 Ocean View Ave
- 367 Ocean View Ave
- 375 Via Linda Del Sur
- 393 Ocean View Ave
- 361 Calle de Adele
- 355 Ocean View Ave
- 391 Ocean View Ave
- 340 Calle de Adele
- 321 Ocean View Ave
- 363 Ocean View Ave
- 365 Via Linda Del Sur
- 309 Ocean View Ave
- 351 Ocean View Ave
- 375 Ocean View Ave
Your Personal Tour Guide
Ask me questions while you tour the home.