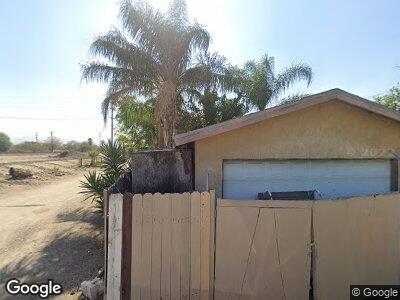
357 W M St Colton, CA 92324
Estimated Value: $448,000 - $482,000
4
Beds
2
Baths
1,301
Sq Ft
$357/Sq Ft
Est. Value
About This Home
This home is located at 357 W M St, Colton, CA 92324 and is currently estimated at $464,440, approximately $356 per square foot. 357 W M St is a home located in San Bernardino County with nearby schools including Paul Rogers Elementary School, Terrace Hills Middle School, and Grand Terrace High School.
Ownership History
Date
Name
Owned For
Owner Type
Purchase Details
Closed on
Mar 25, 1996
Sold by
Saucedo Florentina M
Bought by
Saucedo Joe John and Saucedo Florentina M
Current Estimated Value
Home Financials for this Owner
Home Financials are based on the most recent Mortgage that was taken out on this home.
Original Mortgage
$20,000
Interest Rate
6.98%
Purchase Details
Closed on
Mar 13, 1996
Sold by
Saucedo Joe John
Bought by
Saucedo Florentina M
Home Financials for this Owner
Home Financials are based on the most recent Mortgage that was taken out on this home.
Original Mortgage
$20,000
Interest Rate
6.98%
Create a Home Valuation Report for This Property
The Home Valuation Report is an in-depth analysis detailing your home's value as well as a comparison with similar homes in the area
Home Values in the Area
Average Home Value in this Area
Purchase History
| Date | Buyer | Sale Price | Title Company |
|---|---|---|---|
| Saucedo Joe John | -- | American Title Ins Co | |
| Saucedo Florentina M | -- | -- |
Source: Public Records
Mortgage History
| Date | Status | Borrower | Loan Amount |
|---|---|---|---|
| Closed | Saucero Joe J | $100,000 | |
| Closed | Saucedo Florentina M | $60,000 | |
| Closed | Saucedo Joe John | $20,000 |
Source: Public Records
Tax History Compared to Growth
Tax History
| Year | Tax Paid | Tax Assessment Tax Assessment Total Assessment is a certain percentage of the fair market value that is determined by local assessors to be the total taxable value of land and additions on the property. | Land | Improvement |
|---|---|---|---|---|
| 2024 | $30 | $66,320 | $1,923 | $64,397 |
| 2023 | $30 | $65,019 | $1,885 | $63,134 |
| 2022 | $30 | $63,744 | $1,848 | $61,896 |
| 2021 | $30 | $62,494 | $1,812 | $60,682 |
| 2020 | $30 | $61,853 | $1,793 | $60,060 |
| 2019 | $30 | $60,640 | $1,758 | $58,882 |
| 2018 | $30 | $59,451 | $1,724 | $57,727 |
| 2017 | $30 | $58,285 | $1,690 | $56,595 |
| 2016 | $30 | $57,142 | $1,657 | $55,485 |
| 2015 | $30 | $56,284 | $1,632 | $54,652 |
| 2014 | $30 | $55,181 | $1,600 | $53,581 |
Source: Public Records
Map
Nearby Homes