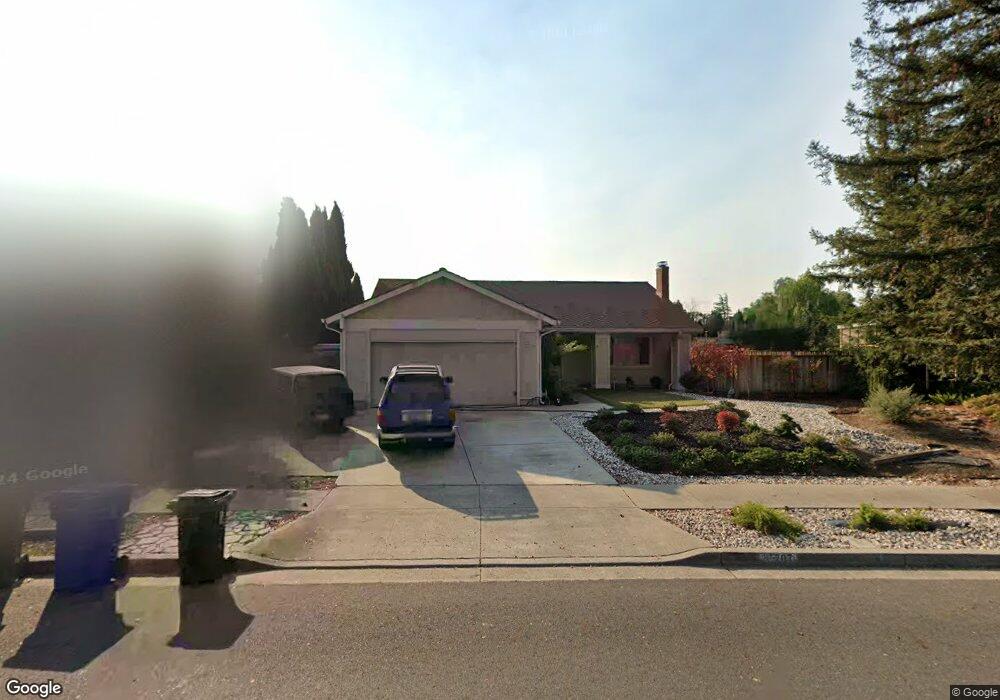
35707 Sheridan Ct Newark, CA 94560
Estimated Value: $1,547,000 - $1,620,792
4
Beds
2
Baths
1,636
Sq Ft
$974/Sq Ft
Est. Value
About This Home
This home is located at 35707 Sheridan Ct, Newark, CA 94560 and is currently estimated at $1,593,698, approximately $974 per square foot. 35707 Sheridan Ct is a home located in Alameda County with nearby schools including John F. Kennedy Elementary School, Newark Junior High School, and Newark Memorial High School.
Ownership History
Date
Name
Owned For
Owner Type
Purchase Details
Closed on
May 22, 2001
Sold by
Arredondo Manuel and Arredondo Milagros
Bought by
Taylor Brent and Hillyard Denice
Current Estimated Value
Home Financials for this Owner
Home Financials are based on the most recent Mortgage that was taken out on this home.
Original Mortgage
$404,000
Outstanding Balance
$156,095
Interest Rate
7.5%
Estimated Equity
$1,437,603
Purchase Details
Closed on
Jun 15, 1998
Sold by
Dimmock James E and Dimmock Judith A
Bought by
Arredondo Manuel and Arredondo Milagros
Home Financials for this Owner
Home Financials are based on the most recent Mortgage that was taken out on this home.
Original Mortgage
$284,000
Interest Rate
7.11%
Create a Home Valuation Report for This Property
The Home Valuation Report is an in-depth analysis detailing your home's value as well as a comparison with similar homes in the area
Home Values in the Area
Average Home Value in this Area
Purchase History
| Date | Buyer | Sale Price | Title Company |
|---|---|---|---|
| Taylor Brent | $505,000 | Chicago Title Co | |
| Arredondo Manuel | $355,000 | Chicago Title Co |
Source: Public Records
Mortgage History
| Date | Status | Borrower | Loan Amount |
|---|---|---|---|
| Open | Taylor Brent | $404,000 | |
| Previous Owner | Arredondo Manuel | $284,000 | |
| Closed | Arredondo Manuel | $17,750 | |
| Closed | Taylor Brent | $75,750 |
Source: Public Records
Tax History Compared to Growth
Tax History
| Year | Tax Paid | Tax Assessment Tax Assessment Total Assessment is a certain percentage of the fair market value that is determined by local assessors to be the total taxable value of land and additions on the property. | Land | Improvement |
|---|---|---|---|---|
| 2025 | $9,306 | $753,898 | $228,269 | $532,629 |
| 2024 | $9,306 | $738,980 | $223,794 | $522,186 |
| 2023 | $9,056 | $731,355 | $219,406 | $511,949 |
| 2022 | $8,941 | $710,018 | $215,105 | $501,913 |
| 2021 | $8,716 | $695,960 | $210,888 | $492,072 |
| 2020 | $8,609 | $695,753 | $208,726 | $487,027 |
| 2019 | $8,485 | $682,113 | $204,634 | $477,479 |
| 2018 | $8,359 | $668,740 | $200,622 | $468,118 |
| 2017 | $8,146 | $655,630 | $196,689 | $458,941 |
| 2016 | $8,066 | $642,778 | $192,833 | $449,945 |
| 2015 | $8,038 | $633,128 | $189,938 | $443,190 |
| 2014 | $7,822 | $620,730 | $186,219 | $434,511 |
Source: Public Records
Map
Nearby Homes
- 5303 Stirling Ct
- 35605 Scarborough Dr
- 5093 Dorking Ct
- 5139 Dryden Ct
- 35220 Cornwall Place
- 4987 Winchester Place
- 36109 Dalewood Dr
- 36202 Worthing Dr
- 36288 Saxon Ct
- 4955 Swindon Place
- 5879 Caleb Ct
- 36139 San Pedro Dr
- 35794 Cabral Dr
- 35936 Magellan Dr
- 6025 Radcliffe Ave
- 5113 Dupont Ave
- 6220 Jarvis Ave
- 6354 Jarvis Ave
- 35856 Adobe Dr
- 35978 Magellan Dr
- 35724 Cedar Blvd
- 35724 Cedar Blvd
- 35673 Sheridan Ct
- 35739 Sheridan Ct
- 35752 Cedar Blvd
- 35752 Cedar Blvd
- 35702 Cedar Blvd
- 35702 Cedar Blvd
- 35657 Sheridan Ct
- 35753 Sheridan Ct
- 35712 Sheridan Ct
- 35778 Cedar Blvd
- 35778 Cedar Blvd
- 5377 Nelson Place
- 35635 Sheridan Ct
- 35789 Sheridan Ct
- 35806 Cedar Blvd
- 35806 Cedar Blvd
- 5359 Nelson Place
- 35764 Sheridan Ct