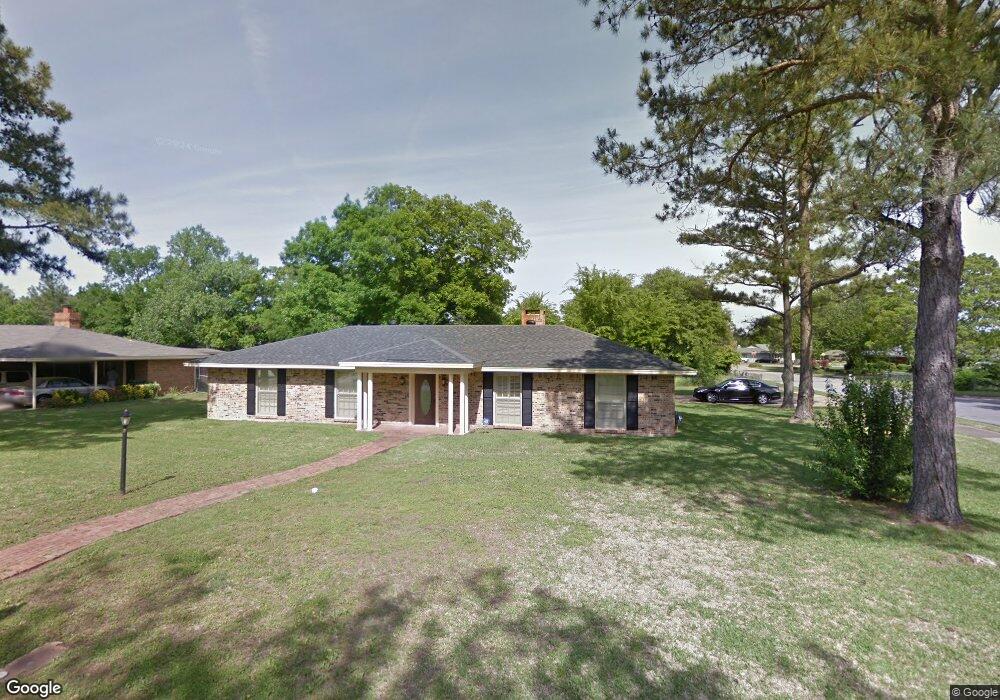
3571 Edgefield Rd Montgomery, AL 36111
Brentwood NeighborhoodEstimated Value: $184,000 - $277,000
--
Bed
--
Bath
2,621
Sq Ft
$81/Sq Ft
Est. Value
About This Home
This home is located at 3571 Edgefield Rd, Montgomery, AL 36111 and is currently estimated at $213,495, approximately $81 per square foot. 3571 Edgefield Rd is a home located in Montgomery County with nearby schools including Dannelly Elementary School, Brewbaker Junior High School, and Johnson Abernathy Graetz (JAG) High School.
Ownership History
Date
Name
Owned For
Owner Type
Purchase Details
Closed on
Aug 30, 2006
Sold by
Darrington Gilbert F and Darrington Melanie
Bought by
Carter Willie and Carter Yolanda
Current Estimated Value
Home Financials for this Owner
Home Financials are based on the most recent Mortgage that was taken out on this home.
Original Mortgage
$148,770
Outstanding Balance
$99,634
Interest Rate
9%
Mortgage Type
New Conventional
Estimated Equity
$113,861
Purchase Details
Closed on
Apr 29, 2002
Sold by
Beury John D and Beury Susan T
Bought by
Darrington Gilbert F and Darrington Melanie
Home Financials for this Owner
Home Financials are based on the most recent Mortgage that was taken out on this home.
Original Mortgage
$140,150
Interest Rate
6.98%
Mortgage Type
VA
Purchase Details
Closed on
Aug 21, 2000
Sold by
Catelli John J and Catelli Janice D
Bought by
Beury John D and Beury Susan T
Create a Home Valuation Report for This Property
The Home Valuation Report is an in-depth analysis detailing your home's value as well as a comparison with similar homes in the area
Home Values in the Area
Average Home Value in this Area
Purchase History
| Date | Buyer | Sale Price | Title Company |
|---|---|---|---|
| Carter Willie | $156,600 | None Available | |
| Darrington Gilbert F | -- | -- | |
| Beury John D | -- | -- |
Source: Public Records
Mortgage History
| Date | Status | Borrower | Loan Amount |
|---|---|---|---|
| Open | Carter Willie | $148,770 | |
| Closed | Darrington Gilbert F | $140,150 |
Source: Public Records
Tax History Compared to Growth
Tax History
| Year | Tax Paid | Tax Assessment Tax Assessment Total Assessment is a certain percentage of the fair market value that is determined by local assessors to be the total taxable value of land and additions on the property. | Land | Improvement |
|---|---|---|---|---|
| 2025 | $904 | $19,480 | $2,500 | $16,980 |
| 2024 | $929 | $19,800 | $2,500 | $17,300 |
| 2023 | $929 | $19,360 | $2,500 | $16,860 |
| 2022 | $585 | $17,160 | $2,500 | $14,660 |
| 2021 | $496 | $14,720 | $0 | $0 |
| 2020 | $480 | $14,280 | $2,500 | $11,780 |
| 2019 | $480 | $14,280 | $2,500 | $11,780 |
| 2018 | $497 | $13,610 | $2,500 | $11,110 |
| 2017 | $471 | $28,080 | $5,000 | $23,080 |
| 2014 | $496 | $14,720 | $2,500 | $12,220 |
| 2013 | -- | $14,550 | $2,500 | $12,050 |
Source: Public Records
Map
Nearby Homes
- 3566 Edgefield Rd
- 3347 Dresden Dr
- 3715 Dresden Ct
- 3515 Foxhall Dr
- 3055 N Colonial Dr
- 2630 Clement Curve
- 3740 Fieldcrest Dr
- 57 Fernway Ct
- 3212 Capstone Ct
- 3481 Fernway Dr
- 3489 Fernway Dr
- 2455 Price St Unit B
- 2451 Price St Unit B
- 3254 Fieldcrest Dr
- 3279 Fieldcrest Dr
- 2445 Winchester Rd
- 2558 Aimee Dr
- 2610 Eldington Dr
- 2831 Crawford St
- 3401 Beck Close
- 3567 Edgefield Rd
- 3370 Dresden Dr
- 3364 Dresden Dr
- 3604 Foxhall Dr
- 3600 Foxhall Dr
- 3592 Foxhall Dr
- 3408 Dresden Dr
- 3358 Dresden Dr
- 3562 Edgefield Rd
- 3559 Edgefield Rd
- 3588 Foxhall Dr
- 3352 Dresden Dr
- 3581 Foxhall Dr
- 3558 Edgefield Rd
- 3573 Foxhall Dr
- 3401 Dresden Dr
- 3555 Edgefield Rd
- 3213 Mcgehee Rd
- 3207 Mcgehee Rd
- 3407 Dresden Dr