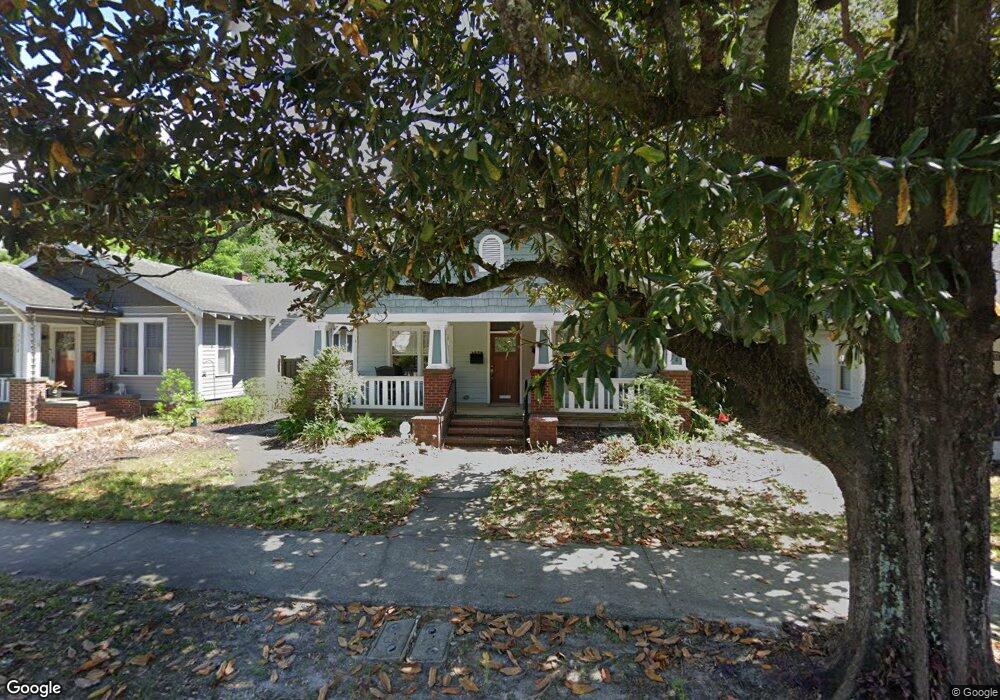
3574 Herschel St Jacksonville, FL 32205
Avondale NeighborhoodEstimated Value: $511,371 - $610,000
3
Beds
2
Baths
1,380
Sq Ft
$406/Sq Ft
Est. Value
About This Home
This home is located at 3574 Herschel St, Jacksonville, FL 32205 and is currently estimated at $560,843, approximately $406 per square foot. 3574 Herschel St is a home located in Duval County with nearby schools including West Riverside Elementary School, Andros Karperos, and Lake Shore Middle School.
Ownership History
Date
Name
Owned For
Owner Type
Purchase Details
Closed on
Dec 9, 2019
Sold by
Smith Elizabeth W
Bought by
Smith Elizabeth W and Elizabeth W Smith Living Trust
Current Estimated Value
Purchase Details
Closed on
Apr 20, 2010
Sold by
Fannie Mae
Bought by
Smith Elizabeth W
Purchase Details
Closed on
Apr 9, 2010
Sold by
Chase Home Finance Llc
Bought by
Federal National Mortgage Association
Purchase Details
Closed on
Mar 1, 2010
Sold by
Mclendon Christopher D and Mclendon Christopher
Bought by
Chase Home Finance Llc
Purchase Details
Closed on
Nov 21, 2005
Sold by
Classic American Building & Remodeling I
Bought by
Mclendon Christopher D and Mclendon Christine A
Home Financials for this Owner
Home Financials are based on the most recent Mortgage that was taken out on this home.
Original Mortgage
$290,372
Interest Rate
5.87%
Mortgage Type
Fannie Mae Freddie Mac
Create a Home Valuation Report for This Property
The Home Valuation Report is an in-depth analysis detailing your home's value as well as a comparison with similar homes in the area
Home Values in the Area
Average Home Value in this Area
Purchase History
| Date | Buyer | Sale Price | Title Company |
|---|---|---|---|
| Smith Elizabeth W | -- | Attorney | |
| Smith Elizabeth W | $237,000 | Reo Title Company Of Fl Llc | |
| Federal National Mortgage Association | -- | Reo Title Company Of Fl Llc | |
| Chase Home Finance Llc | $50,100 | None Available | |
| Mclendon Christopher D | $363,000 | Crossland Title Svcs Llc |
Source: Public Records
Mortgage History
| Date | Status | Borrower | Loan Amount |
|---|---|---|---|
| Previous Owner | Mclendon Christopher D | $290,372 |
Source: Public Records
Tax History Compared to Growth
Tax History
| Year | Tax Paid | Tax Assessment Tax Assessment Total Assessment is a certain percentage of the fair market value that is determined by local assessors to be the total taxable value of land and additions on the property. | Land | Improvement |
|---|---|---|---|---|
| 2025 | $3,423 | $232,408 | -- | -- |
| 2024 | $3,322 | $225,859 | -- | -- |
| 2023 | $3,322 | $219,281 | $0 | $0 |
| 2022 | $3,115 | $212,895 | $0 | $0 |
| 2021 | $3,091 | $206,695 | $0 | $0 |
| 2020 | $2,965 | $198,491 | $0 | $0 |
| 2019 | $2,930 | $194,029 | $0 | $0 |
| 2018 | $2,891 | $190,412 | $0 | $0 |
| 2017 | $2,853 | $186,496 | $0 | $0 |
| 2016 | $2,835 | $182,661 | $0 | $0 |
| 2015 | $2,863 | $181,392 | $0 | $0 |
| 2014 | $2,867 | $179,953 | $0 | $0 |
Source: Public Records
Map
Nearby Homes
- 3612 Riverside Ave
- 3658 Herschel St
- 1608 Talbot Ave
- 3675 Oak St
- 3672 Boone Park Ave
- 3515 Valencia Rd
- 3668 Valencia Rd
- 3638 Walsh St
- 3675 Valencia Rd
- 3677 Walsh St
- 1444 Talbot Ave
- 3665 Hedrick St
- 1492 Avondale Ave
- 3685 Hedrick St
- 1709 Pine Grove Ave
- 1755 Pine Grove Ave
- 1441 Rensselaer Ave
- 1880 Edgewood Ave S
- 3225 St Johns Ave Unit C
- 3216 Oak St Unit 2
- 3572 Herschel St
- 3578 Herschel St
- 3568 Herschel St
- 3579 Oak St
- 3575 Oak St
- 3583 Oak St
- 3569 Oak St
- 3579 Herschel St
- 3579 Herschel St Unit 2
- 3579 Herschel St Unit 3
- 3579 Herschel St Unit 4
- 3583 Herschel St
- 3571 Herschel St
- 3573 Herschel St
- 3602 Herschel St
- 3567 Herschel St
- 3563 Herschel St
- 3559 Oak St
- 3559 Oak St Unit 3
- 3603 Oak St