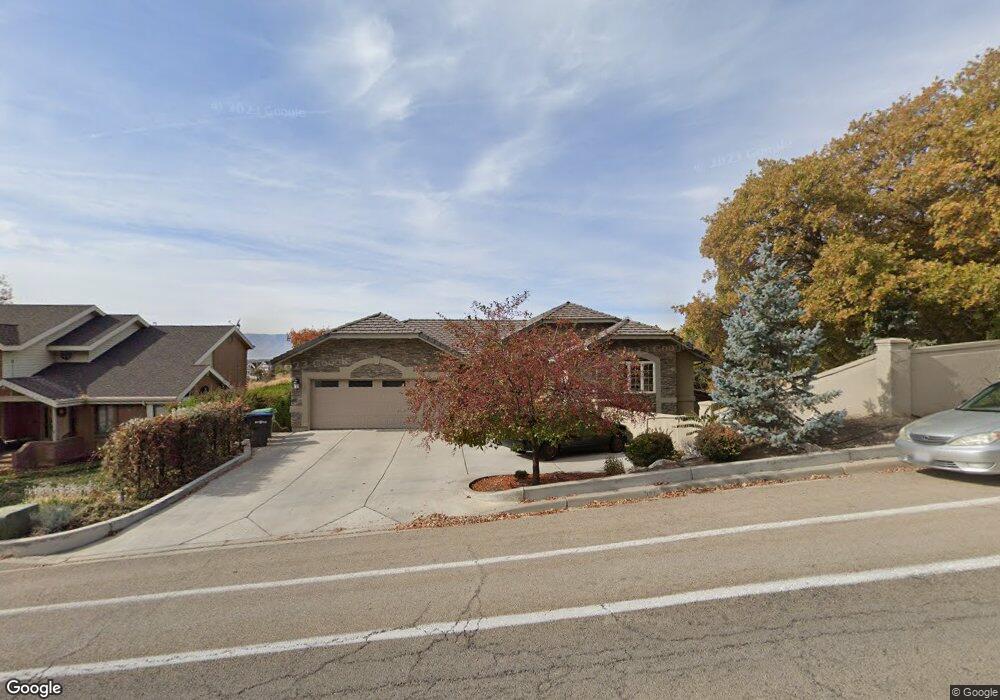
3577 Foothill Dr Provo, UT 84604
Rock Canyon NeighborhoodEstimated Value: $776,000 - $1,083,000
4
Beds
3
Baths
3,830
Sq Ft
$247/Sq Ft
Est. Value
About This Home
This home is located at 3577 Foothill Dr, Provo, UT 84604 and is currently estimated at $947,419, approximately $247 per square foot. 3577 Foothill Dr is a home located in Utah County with nearby schools including Edgemont School, Centennial Middle School, and Timpview High School.
Ownership History
Date
Name
Owned For
Owner Type
Purchase Details
Closed on
Sep 6, 2011
Sold by
Adams David R and Adams Anna M
Bought by
Liebman Marc B and Liebman Mindy J
Current Estimated Value
Home Financials for this Owner
Home Financials are based on the most recent Mortgage that was taken out on this home.
Original Mortgage
$370,800
Outstanding Balance
$256,574
Interest Rate
4.48%
Mortgage Type
New Conventional
Estimated Equity
$690,845
Purchase Details
Closed on
Dec 26, 2001
Sold by
Holbrook Wayne R and Holbrook Clare
Bought by
Adams David R and Adams Anna
Home Financials for this Owner
Home Financials are based on the most recent Mortgage that was taken out on this home.
Original Mortgage
$276,000
Interest Rate
5.37%
Purchase Details
Closed on
May 10, 2000
Sold by
Burr Wesley R and Burr Ruth J
Bought by
Holbrook Wayne R and Holbrook Clare
Home Financials for this Owner
Home Financials are based on the most recent Mortgage that was taken out on this home.
Original Mortgage
$263,900
Interest Rate
8.22%
Create a Home Valuation Report for This Property
The Home Valuation Report is an in-depth analysis detailing your home's value as well as a comparison with similar homes in the area
Home Values in the Area
Average Home Value in this Area
Purchase History
| Date | Buyer | Sale Price | Title Company |
|---|---|---|---|
| Liebman Marc B | -- | Access Title Company | |
| Adams David R | -- | First American Title Insuran | |
| Holbrook Wayne R | -- | First American Title Co |
Source: Public Records
Mortgage History
| Date | Status | Borrower | Loan Amount |
|---|---|---|---|
| Open | Liebman Marc B | $370,800 | |
| Previous Owner | Adams David R | $276,000 | |
| Previous Owner | Holbrook Wayne R | $263,900 | |
| Closed | Holbrook Wayne R | $49,450 |
Source: Public Records
Tax History
| Year | Tax Paid | Tax Assessment Tax Assessment Total Assessment is a certain percentage of the fair market value that is determined by local assessors to be the total taxable value of land and additions on the property. | Land | Improvement |
|---|---|---|---|---|
| 2025 | $4,112 | $431,915 | -- | -- |
| 2024 | $4,112 | $404,800 | $0 | $0 |
| 2023 | $3,966 | $384,890 | $0 | $0 |
| 2022 | $4,176 | $408,595 | $0 | $0 |
| 2021 | $3,233 | $551,700 | $210,200 | $341,500 |
| 2020 | $3,235 | $517,600 | $182,800 | $334,800 |
| 2019 | $3,111 | $517,600 | $182,800 | $334,800 |
| 2018 | $2,858 | $482,300 | $182,800 | $299,500 |
| 2017 | $2,680 | $248,490 | $0 | $0 |
| 2016 | $2,847 | $246,070 | $0 | $0 |
| 2015 | $2,405 | $210,100 | $0 | $0 |
| 2014 | $2,275 | $207,185 | $0 | $0 |
Source: Public Records
Map
Nearby Homes
- 3442 Navajo Ln
- 3411 N Piute Dr
- 3726 Devonshire Dr
- 3702 N 920 E
- 3943 Foothill Dr
- 3129 Cherokee Ln
- 981 Waterford Dr Unit 5&6
- 4299 Ivy Ln
- 758 E 3030 N
- 2848 Foothill Dr
- 3690 N Canyon Rd
- 3711 N Canyon Rd
- 5600 N Canyon Rd
- 407 E 3900 Rd N Unit 1
- 407 E 3900 Rd N
- 3588 N 230 E
- 299 E 4000 N
- 924 Redford Dr
- 1108 E 2620 N
- 4161 N Canyon Rd Unit 2
- 3565 Foothill Dr
- 3594 Foothill Dr
- 3550 Foothill Dr
- 3533 Foothill Dr
- 3612 Foothill Dr
- 1181 Mountain Ridge Rd
- 3655 Foothill Dr
- 3642 Foothill Dr
- 3540 Foothill Dr
- 3187 Foothill Dr
- 4613 Foothill Dr Unit 4
- 3138 Foothill Dr Unit 3
- 1202 Foothill Dr Unit 21
- 1175 Mountain Ridge Rd
- 3530 Foothill Dr
- 3563 N Souix Cir E
- 3605 Piute Dr
- 3563 Sioux Cir
- 3619 Piute Dr
- 3619 Piute Dr
Your Personal Tour Guide
Ask me questions while you tour the home.