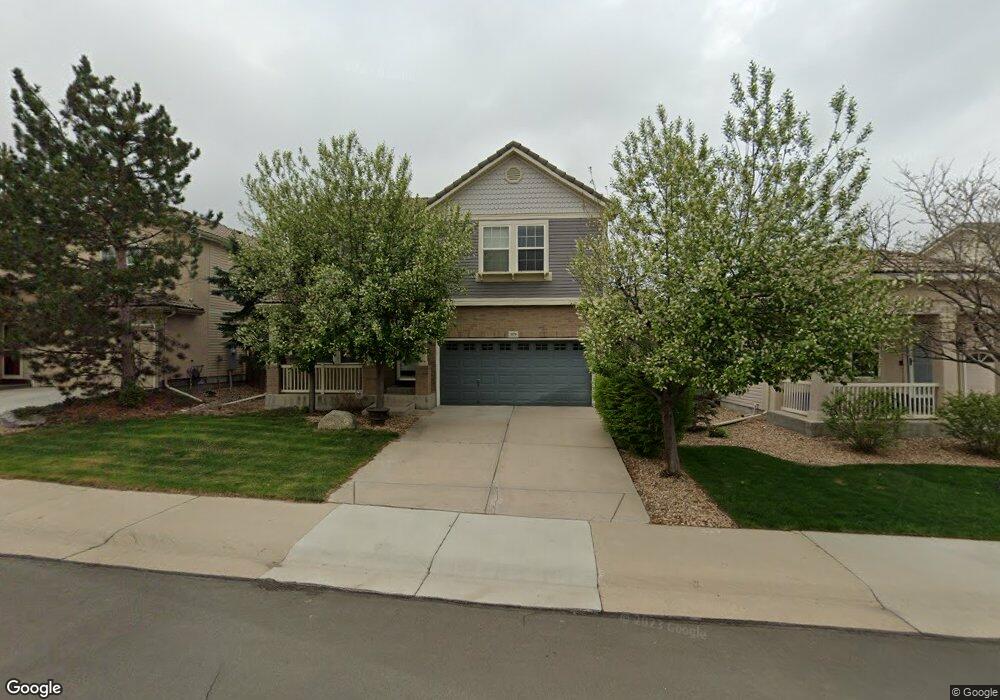
3578 Dinosaur St Castle Rock, CO 80109
The Meadows NeighborhoodEstimated Value: $583,000 - $612,426
4
Beds
4
Baths
3,078
Sq Ft
$194/Sq Ft
Est. Value
About This Home
This home is located at 3578 Dinosaur St, Castle Rock, CO 80109 and is currently estimated at $595,857, approximately $193 per square foot. 3578 Dinosaur St is a home located in Douglas County with nearby schools including Clear Sky Elementary School, Castle Rock Middle School, and Castle View High School.
Ownership History
Date
Name
Owned For
Owner Type
Purchase Details
Closed on
Sep 30, 2010
Sold by
Dodge N P
Bought by
Walters David
Current Estimated Value
Home Financials for this Owner
Home Financials are based on the most recent Mortgage that was taken out on this home.
Original Mortgage
$123,000
Outstanding Balance
$81,332
Interest Rate
4.39%
Mortgage Type
New Conventional
Estimated Equity
$514,525
Purchase Details
Closed on
Nov 9, 2007
Sold by
Pl Model Home Investments Llc
Bought by
Nixon Kathleen K
Home Financials for this Owner
Home Financials are based on the most recent Mortgage that was taken out on this home.
Original Mortgage
$216,000
Interest Rate
6.42%
Mortgage Type
Unknown
Purchase Details
Closed on
Sep 30, 2005
Sold by
Hc Development & Management Services Inc
Bought by
Oakwood Homes Llc
Purchase Details
Closed on
Sep 12, 2005
Sold by
Castle Rock Development Co
Bought by
Hc Development & Management Services Inc
Create a Home Valuation Report for This Property
The Home Valuation Report is an in-depth analysis detailing your home's value as well as a comparison with similar homes in the area
Home Values in the Area
Average Home Value in this Area
Purchase History
| Date | Buyer | Sale Price | Title Company |
|---|---|---|---|
| Walters David | $228,000 | Stewart Title | |
| Dodge N P | $228,000 | Stewart Title | |
| Nixon Kathleen K | $270,200 | Town & Country Title Service | |
| Oakwood Homes Llc | -- | -- | |
| Oakwood Homes Llc | $617,700 | -- | |
| Hc Development & Management Services Inc | $770,400 | -- |
Source: Public Records
Mortgage History
| Date | Status | Borrower | Loan Amount |
|---|---|---|---|
| Open | Walters David | $123,000 | |
| Previous Owner | Nixon Kathleen K | $216,000 |
Source: Public Records
Tax History Compared to Growth
Tax History
| Year | Tax Paid | Tax Assessment Tax Assessment Total Assessment is a certain percentage of the fair market value that is determined by local assessors to be the total taxable value of land and additions on the property. | Land | Improvement |
|---|---|---|---|---|
| 2024 | $3,362 | $42,620 | $7,710 | $34,910 |
| 2023 | $3,393 | $42,620 | $7,710 | $34,910 |
| 2022 | $2,221 | $28,800 | $5,760 | $23,040 |
| 2021 | $2,307 | $28,800 | $5,760 | $23,040 |
| 2020 | $2,949 | $28,600 | $4,580 | $24,020 |
| 2019 | $2,959 | $28,600 | $4,580 | $24,020 |
| 2018 | $2,678 | $25,450 | $4,450 | $21,000 |
| 2017 | $2,526 | $25,450 | $4,450 | $21,000 |
| 2016 | $2,336 | $23,130 | $4,680 | $18,450 |
| 2015 | $2,380 | $23,130 | $4,680 | $18,450 |
| 2014 | $2,116 | $19,420 | $2,790 | $16,630 |
Source: Public Records
Map
Nearby Homes
- 3607 Dinosaur St
- 1744 Hogan Ct
- 1975 Hogan Ct
- 3560 Starry Night Loop
- 3868 Alcazar Dr
- 2002 Quartz St
- 2307 Candleglow St
- 3628 Sky Church Dr
- 2199 Broadleaf Loop
- 3934 Alcazar Dr
- 3334 Starry Night Loop
- 1648 Exquisite St
- 1479 Raindrop Way
- 3871 Starry Night Loop
- 1385 Candleglow St
- 2175 Coach House Loop
- 1815 Avery Way
- 1414 Freedom Way
- 2383 Coach House Loop
- 2339 Robindale Way
- 3554 Dinosaur St
- 3600 Dinosaur St
- 3530 Dinosaur St
- 3624 Dinosaur St
- 1792 Hogan Ct
- 1798 Hogan Ct
- 1774 Hogan Ct
- 1814 Hogan Ct
- 3565 Dinosaur St
- 3498 Dinosaur St
- 3638 Dinosaur St
- 3583 Dinosaur St
- 3547 Dinosaur St
- 1758 Hogan Ct
- 3523 Dinosaur St
- 1822 Hogan Ct
- 3625 Dinosaur St
- 3476 Dinosaur St
- 3505 Dinosaur St
- 3641 Dinosaur St