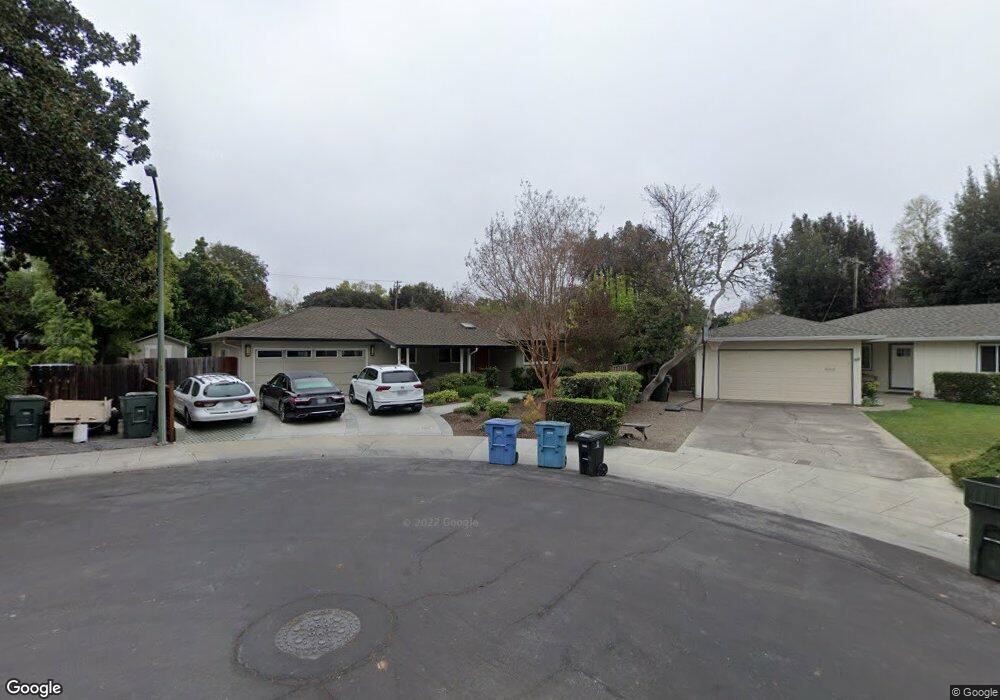
358 Christopher Ct Palo Alto, CA 94306
Greenmeadow NeighborhoodEstimated Value: $3,038,000 - $3,280,000
3
Beds
2
Baths
1,468
Sq Ft
$2,176/Sq Ft
Est. Value
About This Home
This home is located at 358 Christopher Ct, Palo Alto, CA 94306 and is currently estimated at $3,193,939, approximately $2,175 per square foot. 358 Christopher Ct is a home located in Santa Clara County with nearby schools including Fairmeadow Elementary School, Jane Lathrop Stanford Middle School, and Henry M. Gunn High School.
Ownership History
Date
Name
Owned For
Owner Type
Purchase Details
Closed on
Jul 24, 2013
Sold by
Lindholm Grant D
Bought by
Lindholm Grant D
Current Estimated Value
Purchase Details
Closed on
Jan 18, 2012
Sold by
Lindholm Grant Dean
Bought by
Lindholm Grant D
Purchase Details
Closed on
May 19, 2010
Sold by
Lindholm Grant Dean
Bought by
Lindholm Grant D
Purchase Details
Closed on
Jan 3, 2001
Sold by
Lindholm Frank J Trustee and Lindholm Grant D Trustee
Bought by
Lindholm Frank J and Lindholm Grant Dean
Create a Home Valuation Report for This Property
The Home Valuation Report is an in-depth analysis detailing your home's value as well as a comparison with similar homes in the area
Home Values in the Area
Average Home Value in this Area
Purchase History
| Date | Buyer | Sale Price | Title Company |
|---|---|---|---|
| Lindholm Grant D | -- | None Available | |
| Lindholm Grant D | -- | Chicago Title Company | |
| Lindholm Grant D | -- | None Available | |
| Lindholm Grant D | -- | None Available | |
| Lindholm Frank J | -- | -- |
Source: Public Records
Tax History Compared to Growth
Tax History
| Year | Tax Paid | Tax Assessment Tax Assessment Total Assessment is a certain percentage of the fair market value that is determined by local assessors to be the total taxable value of land and additions on the property. | Land | Improvement |
|---|---|---|---|---|
| 2025 | $2,515 | $129,977 | $41,752 | $88,225 |
| 2024 | $2,515 | $127,430 | $40,934 | $86,496 |
| 2023 | $2,474 | $124,932 | $40,132 | $84,800 |
| 2022 | $2,436 | $122,484 | $39,346 | $83,138 |
| 2021 | $2,387 | $120,083 | $38,575 | $81,508 |
| 2020 | $2,355 | $118,853 | $38,180 | $80,673 |
| 2019 | $2,324 | $116,524 | $37,432 | $79,092 |
| 2018 | $2,281 | $114,241 | $36,699 | $77,542 |
| 2017 | $3,321 | $203,729 | $35,980 | $167,749 |
| 2016 | $3,229 | $199,735 | $35,275 | $164,460 |
| 2015 | $3,190 | $196,736 | $34,746 | $161,990 |
| 2014 | $3,034 | $192,883 | $34,066 | $158,817 |
Source: Public Records
Map
Nearby Homes
- 444 San Antonio Rd Unit 1A
- 432 Victory Ave
- 2483 Whitney Dr
- 181 Del Medio Ave Unit 307
- 2474 Alvin St
- 2524 W Middlefield Rd Unit 2
- 103 Whits Rd
- 278 Monroe Dr Unit 17
- 49 Showers Dr Unit J317
- 49 Showers Dr Unit D460
- 49 Showers Dr Unit E151
- 777 San Antonio Rd Unit 93
- 4225 Park Blvd
- 2375 Adele Ave
- 3946 Louis Rd
- 795 E Charleston Rd
- 347 N Rengstorff Ave
- 363 N Rengstorff Ave Unit 5
- 2064 Rialto Ct
- 342 Carolina Ln
- 355 Christopher Ct
- 351 San Antonio Rd
- 370 Christopher Ct
- 355 San Antonio Rd
- 355 San Antonio Ave
- 4257 Mackay Dr
- 351 San Antonio Ave
- 4277 Mackay Dr
- 361 Christopher Ct
- 4237 Mackay Dr
- 367 San Antonio Rd
- 325 San Antonio Rd
- 369 Christopher Ct
- 4217 Mackay Dr
- 382 Christopher Ct
- 336 Calcaterra Place
- 379 San Antonio Rd
- 320 Calcaterra Place
- 352 Calcaterra Place
- 381 Christopher Ct