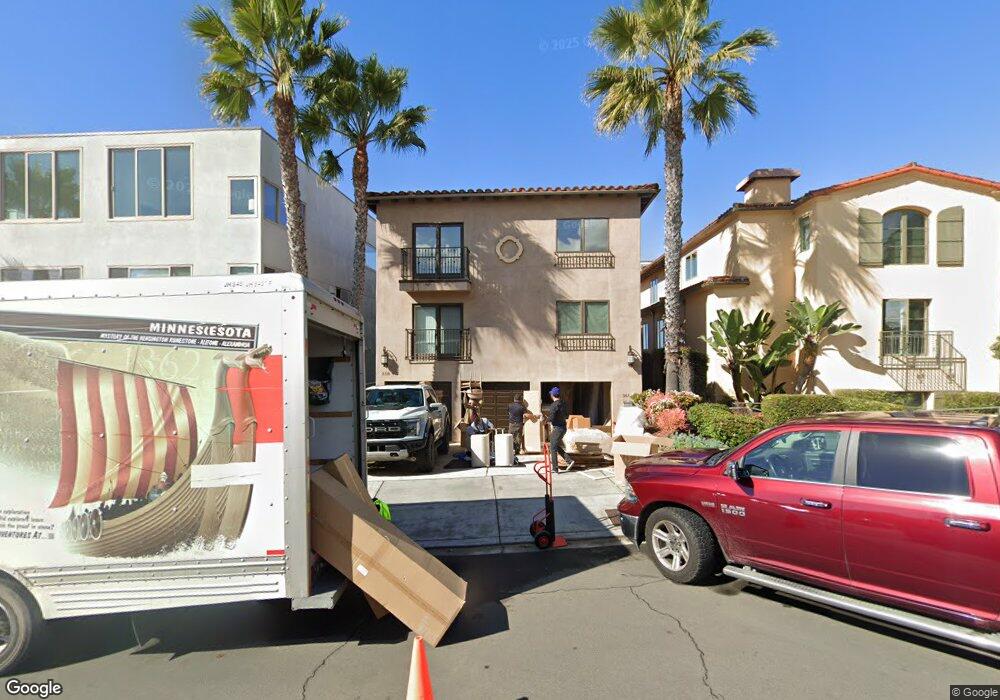
358 Prospect St Unit C La Jolla, CA 92037
The Village NeighborhoodEstimated Value: $1,074,318 - $1,998,000
1
Bed
2
Baths
864
Sq Ft
$1,686/Sq Ft
Est. Value
About This Home
This home is located at 358 Prospect St Unit C, La Jolla, CA 92037 and is currently estimated at $1,456,580, approximately $1,685 per square foot. 358 Prospect St Unit C is a home located in San Diego County with nearby schools including La Jolla Elementary School, Muirlands Middle School, and La Jolla High School.
Ownership History
Date
Name
Owned For
Owner Type
Purchase Details
Closed on
Apr 21, 2021
Sold by
Siegel Philip S
Bought by
Siegel Lauren M
Current Estimated Value
Purchase Details
Closed on
Jun 20, 2014
Sold by
Siegel Philip and Siegel Lauren Murphy
Bought by
Siegel Philip S and Siegel Lauren M
Purchase Details
Closed on
Jan 18, 2012
Sold by
Dennis John L and Dennis Susan A
Bought by
Siegel Philip and Siegel Lauren Murphy
Home Financials for this Owner
Home Financials are based on the most recent Mortgage that was taken out on this home.
Original Mortgage
$420,000
Outstanding Balance
$274,109
Interest Rate
3%
Mortgage Type
New Conventional
Estimated Equity
$1,182,471
Purchase Details
Closed on
Aug 26, 2010
Sold by
Nachreiner James N
Bought by
Nachreiner James and Nachreiner Felicia
Purchase Details
Closed on
Oct 29, 2009
Sold by
Nachreiner Felicia
Bought by
Nachreiner James N
Purchase Details
Closed on
Nov 17, 2008
Sold by
Jamusan Prospect View Development Llc
Bought by
Dennis John L and Dennis Susan A
Purchase Details
Closed on
Nov 29, 2007
Sold by
Jamusan Prospect View Development Llc
Bought by
Dennis John L and Dennis Susan A
Create a Home Valuation Report for This Property
The Home Valuation Report is an in-depth analysis detailing your home's value as well as a comparison with similar homes in the area
Home Values in the Area
Average Home Value in this Area
Purchase History
| Date | Buyer | Sale Price | Title Company |
|---|---|---|---|
| Siegel Lauren M | -- | None Available | |
| Siegel Philip S | -- | None Available | |
| Siegel Philip S | -- | Fidelity National Title | |
| Siegel Philip S | -- | None Available | |
| Siegel Philip | $555,000 | California Title Company | |
| Nachreiner James | -- | None Available | |
| Nachreiner James N | -- | Lawyers Title Insurance Corp | |
| Dennis John L | -- | None Available | |
| Dennis John L | -- | None Available |
Source: Public Records
Mortgage History
| Date | Status | Borrower | Loan Amount |
|---|---|---|---|
| Open | Siegel Philip | $420,000 |
Source: Public Records
Tax History Compared to Growth
Tax History
| Year | Tax Paid | Tax Assessment Tax Assessment Total Assessment is a certain percentage of the fair market value that is determined by local assessors to be the total taxable value of land and additions on the property. | Land | Improvement |
|---|---|---|---|---|
| 2025 | $8,425 | $697,102 | $502,418 | $194,684 |
| 2024 | $8,425 | $683,434 | $492,567 | $190,867 |
| 2023 | $8,239 | $670,034 | $482,909 | $187,125 |
| 2022 | $8,021 | $656,897 | $473,441 | $183,456 |
| 2021 | $7,966 | $644,017 | $464,158 | $179,859 |
| 2020 | $7,869 | $637,414 | $459,399 | $178,015 |
| 2019 | $7,729 | $624,917 | $450,392 | $174,525 |
| 2018 | $7,226 | $612,664 | $441,561 | $171,103 |
| 2017 | $7,055 | $600,652 | $432,903 | $167,749 |
| 2016 | $6,943 | $588,875 | $424,415 | $164,460 |
| 2015 | $6,841 | $580,030 | $418,040 | $161,990 |
| 2014 | $6,733 | $568,669 | $409,852 | $158,817 |
Source: Public Records
Map
Nearby Homes
- 357 Coast Blvd S
- 302 Prospect St Unit 7
- 302 Prospect St Unit 6
- 265 Coast Blvd Unit 9
- 229 Coast Blvd Unit U1
- 220 Coast Blvd Unit 2M
- 202 Coast Blvd Unit 4
- 100 Coast Blvd Unit 101
- 7635 Draper Ave Unit LU4
- 7520 Draper Ave Unit 3
- 726 Silver St
- 708 Silver St
- 718 Silver St
- 7560 Eads Ave Unit 12
- 7601 Eads Ave
- 7757 Eads Ave Unit B7
- 800 Prospect St Unit 1F
- 346 Dunemere Dr
- 609 Genter St
- 7372 Fay Ave
- 358 Prospect St Unit A
- 358 Prospect St Unit B
- 366 Prospect St
- 370 Prospect St
- 0 Prospect Unit B NDP2103382
- 356 Prospect St Unit N2
- 356 Prospect St Unit S2
- 356 Prospect St Unit S3
- 356 Prospect St Unit N4
- 356 Prospect St Unit S4
- 356 Prospect St Unit N1
- 356 Prospect St Unit S1
- 364 Prospect St
- 360 Prospect St
- 344 Prospect St Unit A
- 344 Prospect St Unit C
- 344 Prospect St Unit B
- 344 Prospect St Unit E
- 372 Prospect St Unit 5
- 362 Prospect St