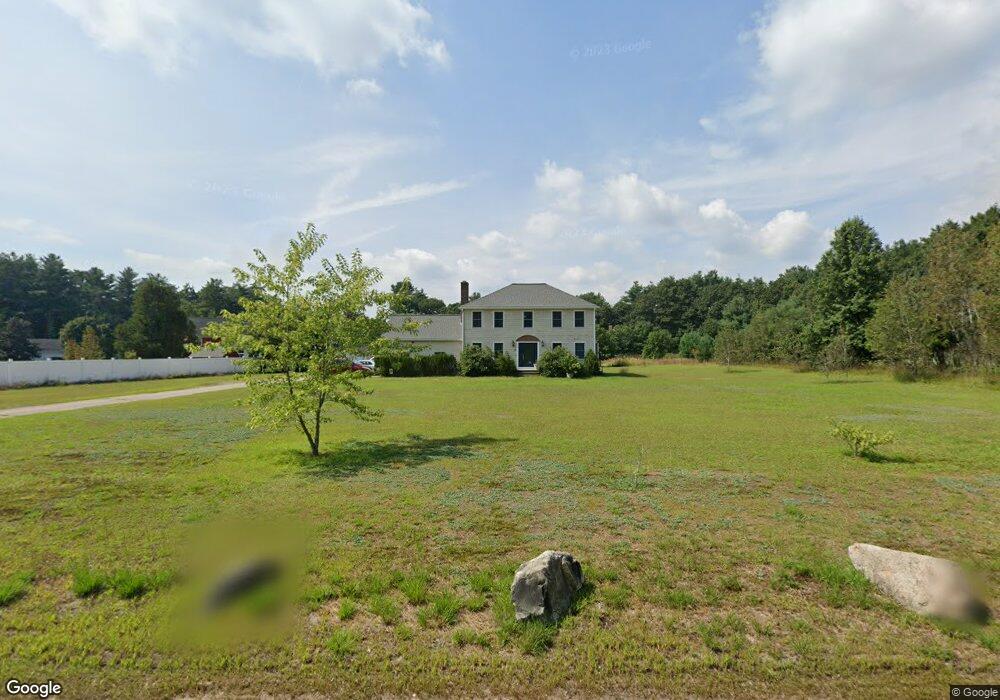
359 Grove St Franklin, MA 02038
Wadsworth NeighborhoodEstimated Value: $760,000 - $905,000
About This Home
This home is located at 359 Grove St, Franklin, MA 02038 and is currently estimated at $812,837, approximately $429 per square foot. 359 Grove St is a home located in Norfolk County with nearby schools including Jefferson Elementary School, Remington Middle School, and Franklin High School.
Ownership History
We collect this data history from publicly available records. To have your information removed, we recommend requesting removal directly through your county’s website.
Purchase Details
Home Financials for this Owner
Home Financials are based on the most recent Mortgage that was taken out on this home.Home Values in the Area
Average Home Value in this Area
Purchase History
We collect this data history from publicly available records. To have your information removed, we recommend requesting removal directly through your county’s website.
| Date | Buyer | Sale Price | Title Company |
|---|---|---|---|
| $215,000 | -- |
Mortgage History
We collect this data history from publicly available records. To have your information removed, we recommend requesting removal directly through your county’s website.
| Date | Status | Borrower | Loan Amount |
|---|---|---|---|
| Open | $97,000 | ||
| Closed | $133,000 | ||
| Closed | $150,000 | ||
| Closed | $172,000 |
Tax History
We collect this data history from publicly available records. To have your information removed, we recommend requesting removal directly through your county’s website.
| Year | Tax Paid | Tax Assessment Tax Assessment Total Assessment is a certain percentage of the fair market value that is determined by local assessors to be the total taxable value of land and additions on the property. | Land | Improvement |
|---|---|---|---|---|
| 2025 | $7,713 | $663,800 | $242,900 | $420,900 |
| 2024 | $7,324 | $621,200 | $242,900 | $378,300 |
| 2023 | $7,478 | $594,400 | $265,100 | $329,300 |
| 2022 | $6,941 | $494,000 | $202,400 | $291,600 |
| 2021 | $6,992 | $477,300 | $210,800 | $266,500 |
| 2020 | $6,770 | $466,600 | $212,700 | $253,900 |
| 2019 | $6,458 | $440,500 | $186,600 | $253,900 |
| 2018 | $6,138 | $419,000 | $190,300 | $228,700 |
| 2017 | $6,055 | $415,300 | $186,600 | $228,700 |
| 2016 | $6,090 | $420,000 | $193,200 | $226,800 |
| 2015 | $5,957 | $401,400 | $174,600 | $226,800 |
| 2014 | $5,414 | $374,700 | $169,500 | $205,200 |
Map
- 713 Washington St
- 2 Spring St
- 3 Gwynne Rd
- 36 Jackson Cir
- 6 Nicholas Dr
- 871 Washington St
- 11 Peters Ln
- 39 Jackson Cir
- 2 Harrison Place
- 241 Prospect St
- 900 Washington St Lot 2
- 20 Anna Rd
- 57 A St Unit 57
- 4 Dix Rd
- 31 Cassandra Ave Unit 31
- 51 Benjamin Landing Ln
- 120 Stone Ridge Rd Unit 120
- 14 Benjamin Landing Ln Unit 14
- 1 Washington St
- 3 Washington St
Ask me questions while you tour the home.