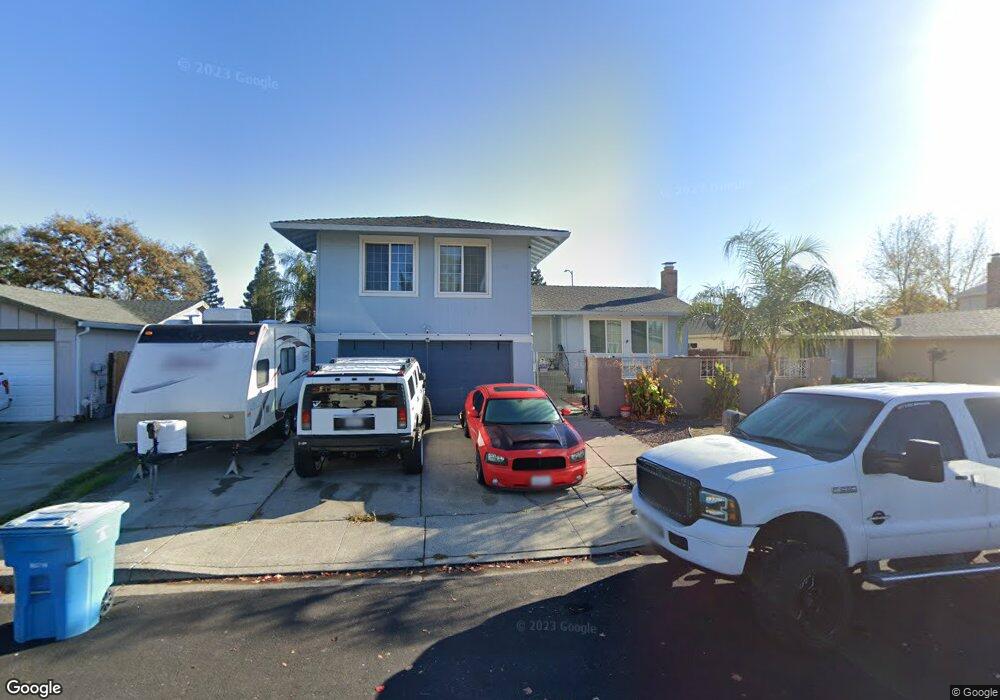
359 Hanover Way Vacaville, CA 95687
Estimated Value: $527,000 - $584,000
4
Beds
3
Baths
1,799
Sq Ft
$306/Sq Ft
Est. Value
About This Home
This home is located at 359 Hanover Way, Vacaville, CA 95687 and is currently estimated at $551,142, approximately $306 per square foot. 359 Hanover Way is a home located in Solano County with nearby schools including Eugene Padan Elementary School, Orchard Elementary School, and Vaca Pena Middle School.
Ownership History
Date
Name
Owned For
Owner Type
Purchase Details
Closed on
May 1, 2013
Sold by
Anderson Robert C and Anderson Shirley
Bought by
Lougee Ryan
Current Estimated Value
Purchase Details
Closed on
Mar 7, 2005
Sold by
Anderson Robert C and Anderson Shirley
Bought by
Anderson Robert C and Anderson Shirley
Home Financials for this Owner
Home Financials are based on the most recent Mortgage that was taken out on this home.
Original Mortgage
$109,000
Interest Rate
5.61%
Mortgage Type
Credit Line Revolving
Purchase Details
Closed on
Aug 11, 1995
Sold by
P S Associates
Bought by
Anderson Robert C and Smith Shirley M
Home Financials for this Owner
Home Financials are based on the most recent Mortgage that was taken out on this home.
Original Mortgage
$148,058
Interest Rate
7.71%
Mortgage Type
FHA
Create a Home Valuation Report for This Property
The Home Valuation Report is an in-depth analysis detailing your home's value as well as a comparison with similar homes in the area
Purchase History
| Date | Buyer | Sale Price | Title Company |
|---|---|---|---|
| Lougee Ryan | $240,000 | Placer Title Company | |
| Anderson Robert C | -- | -- | |
| Anderson Robert C | $150,000 | First American Title Guarant |
Source: Public Records
Mortgage History
| Date | Status | Borrower | Loan Amount |
|---|---|---|---|
| Previous Owner | Anderson Robert C | $109,000 | |
| Previous Owner | Anderson Robert C | $148,058 |
Source: Public Records
Tax History
| Year | Tax Paid | Tax Assessment Tax Assessment Total Assessment is a certain percentage of the fair market value that is determined by local assessors to be the total taxable value of land and additions on the property. | Land | Improvement |
|---|---|---|---|---|
| 2025 | $3,403 | $295,531 | $73,880 | $221,651 |
| 2024 | $3,403 | $289,737 | $72,432 | $217,305 |
| 2023 | $3,323 | $284,057 | $71,012 | $213,045 |
| 2022 | $3,237 | $278,488 | $69,620 | $208,868 |
| 2021 | $3,739 | $273,028 | $68,255 | $204,773 |
| 2020 | $3,673 | $270,230 | $67,556 | $202,674 |
| 2019 | $3,600 | $264,932 | $66,232 | $198,700 |
| 2018 | $3,551 | $259,738 | $64,934 | $194,804 |
| 2017 | $3,435 | $254,646 | $63,661 | $190,985 |
| 2016 | $3,406 | $249,654 | $62,413 | $187,241 |
| 2015 | $3,354 | $245,905 | $61,476 | $184,429 |
| 2014 | $3,066 | $241,089 | $60,272 | $180,817 |
Source: Public Records
Map
Nearby Homes
- 160 Bristol Dr
- 124 Dover Way
- 207 Arlington Way
- 113 Christine Dr
- 1801 Marshall Rd Unit 801
- 1801 Marshall Rd Unit 408
- 875 Christine Dr
- 107 Cavan Ct
- 717 Beelard Dr
- 106 Kerry Ct
- 642 White Oak Ln
- 112 Melrose Ct
- 526 Regency Cir
- 2099 Marshall Rd
- 248 Colby Dr
- 113 Richard Place
- 690 Arcadia Dr
- 631 Sunnyvale Place
- 0 Marshall Rd Unit 325032355
- 0 Marshall Rd Unit 325032407
Your Personal Tour Guide
Ask me questions while you tour the home.