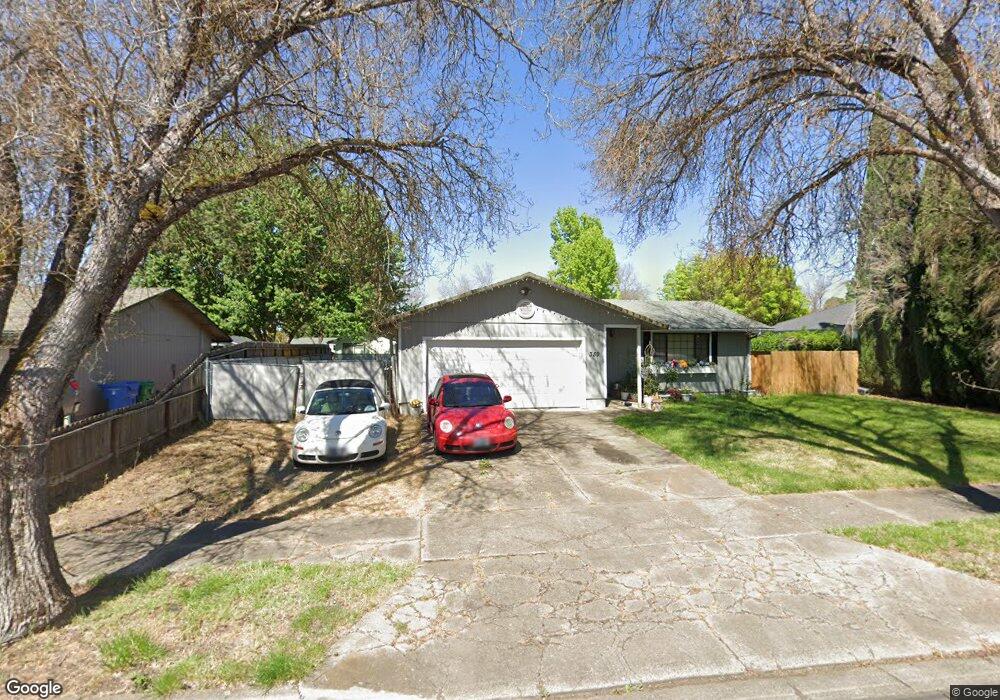
359 Shadow Lawn Dr Eagle Point, OR 97524
Estimated Value: $290,000 - $358,000
3
Beds
2
Baths
1,240
Sq Ft
$272/Sq Ft
Est. Value
About This Home
This home is located at 359 Shadow Lawn Dr, Eagle Point, OR 97524 and is currently estimated at $337,539, approximately $272 per square foot. 359 Shadow Lawn Dr is a home located in Jackson County with nearby schools including Eagle Rock Elementary School, Eagle Point Middle School, and White Mountain Middle School.
Ownership History
Date
Name
Owned For
Owner Type
Purchase Details
Closed on
Aug 28, 2007
Sold by
Souza Judi E
Bought by
Samhammer Brian C and Samhammer Mandy K
Current Estimated Value
Home Financials for this Owner
Home Financials are based on the most recent Mortgage that was taken out on this home.
Original Mortgage
$230,384
Outstanding Balance
$144,441
Interest Rate
6.74%
Mortgage Type
FHA
Estimated Equity
$193,098
Purchase Details
Closed on
Aug 14, 2003
Sold by
Oster David G and Reviea Oster Suzanne D
Bought by
Souza Judi E
Home Financials for this Owner
Home Financials are based on the most recent Mortgage that was taken out on this home.
Original Mortgage
$138,600
Interest Rate
5.29%
Mortgage Type
Purchase Money Mortgage
Purchase Details
Closed on
May 21, 1998
Sold by
Nutter Bruce R and Nutter Lori L
Bought by
Oster David G and Reviea Oster Suzanne D
Home Financials for this Owner
Home Financials are based on the most recent Mortgage that was taken out on this home.
Original Mortgage
$114,111
Interest Rate
7.07%
Mortgage Type
FHA
Create a Home Valuation Report for This Property
The Home Valuation Report is an in-depth analysis detailing your home's value as well as a comparison with similar homes in the area
Home Values in the Area
Average Home Value in this Area
Purchase History
| Date | Buyer | Sale Price | Title Company |
|---|---|---|---|
| Samhammer Brian C | $234,000 | Amerititle | |
| Souza Judi E | $154,000 | Amerititle | |
| Oster David G | $115,500 | Amerititle |
Source: Public Records
Mortgage History
| Date | Status | Borrower | Loan Amount |
|---|---|---|---|
| Open | Samhammer Brian C | $230,384 | |
| Previous Owner | Souza Judi E | $138,600 | |
| Previous Owner | Oster David G | $114,111 |
Source: Public Records
Tax History
| Year | Tax Paid | Tax Assessment Tax Assessment Total Assessment is a certain percentage of the fair market value that is determined by local assessors to be the total taxable value of land and additions on the property. | Land | Improvement |
|---|---|---|---|---|
| 2026 | $2,579 | $189,520 | -- | -- |
| 2025 | $2,518 | $184,000 | $89,140 | $94,860 |
| 2024 | $2,518 | $178,650 | $86,540 | $92,110 |
| 2023 | $2,432 | $173,450 | $84,020 | $89,430 |
| 2022 | $2,366 | $173,450 | $84,020 | $89,430 |
| 2021 | $2,296 | $168,400 | $81,580 | $86,820 |
| 2020 | $2,439 | $163,500 | $79,210 | $84,290 |
| 2019 | $2,402 | $154,120 | $74,660 | $79,460 |
| 2018 | $2,356 | $149,640 | $72,480 | $77,160 |
| 2017 | $2,299 | $149,640 | $72,480 | $77,160 |
| 2016 | $2,254 | $141,060 | $68,320 | $72,740 |
| 2015 | $2,171 | $141,060 | $68,320 | $72,740 |
| 2014 | $2,109 | $132,980 | $64,400 | $68,580 |
Source: Public Records
Map
Nearby Homes
- 633 E Archwood Dr Unit 46
- 633 E Archwood Dr Unit 89
- 633 E Archwood Dr Unit 60
- 633 E Archwood Dr Unit 44
- 633 E Archwood Dr Unit 131
- 633 E Archwood Dr Unit 12
- 633 E Archwood Dr Unit 70
- 633 E Archwood Dr Unit 53
- 633 E Archwood Dr Unit 130
- 633 E Archwood Dr Unit 125
- 438 Westminster Dr
- 417 Crystal Dr
- 124 Paxon Ave
- 1023 Highlands Dr
- 388 Crystal Dr
- 468 Merlee Cir
- 1017 Havenwood Dr
- 545 N Heights Dr
- 142 Onyx St
- 208 Northview Dr Unit 1B
- 365 Shadow Lawn Dr
- 345 Shadow Lawn Dr
- 364 Teakwood Dr
- 371 Shadow Lawn Dr
- 334 Teakwood Dr
- 337 Shadow Lawn Dr
- 352 Shadow Lawn Dr
- 358 Shadow Lawn Dr
- 344 Shadow Lawn Dr
- 376 Teakwood Dr
- 377 Shadow Lawn Dr
- 326 Teakwood Dr
- 364 Shadow Lawn Dr
- 329 Shadow Lawn Dr
- 332 Shadow Lawn Dr
- 372 Shadow Lawn Dr
- 383 Shadow Lawn Dr
- 357 Teakwood Dr
- 345 Candis Dr
- 365 Teakwood Dr
Your Personal Tour Guide
Ask me questions while you tour the home.