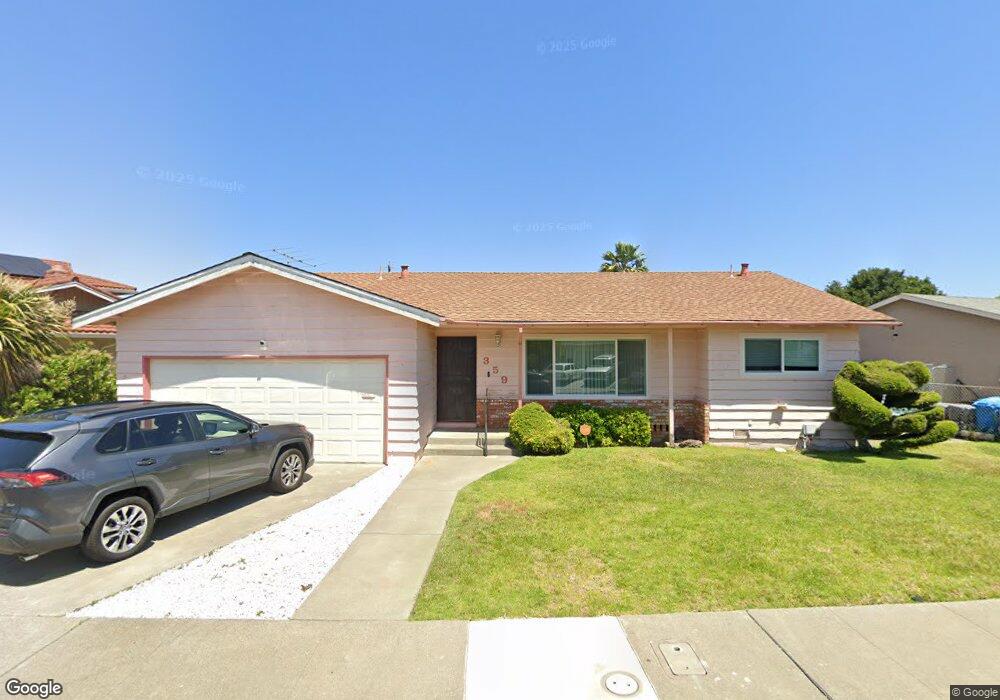
359 Winchester St Vallejo, CA 94590
South Vallejo NeighborhoodEstimated Value: $262,000 - $472,000
2
Beds
2
Baths
1,443
Sq Ft
$262/Sq Ft
Est. Value
About This Home
This home is located at 359 Winchester St, Vallejo, CA 94590 and is currently estimated at $377,458, approximately $261 per square foot. 359 Winchester St is a home located in Solano County with nearby schools including Grace Patterson Elementary School, Vallejo High School, and Mustard Seed Preschool and Kindergarten.
Ownership History
Date
Name
Owned For
Owner Type
Purchase Details
Closed on
Oct 31, 2024
Sold by
Ward Family Trust and Ward Arthur E
Bought by
Yolanda Denson Revocable Living Trust and Denson
Current Estimated Value
Purchase Details
Closed on
Oct 17, 2024
Sold by
Ward Family Trust and Ward Arthur E
Bought by
Yolanda Denson Revocable Living Trust and Denson
Purchase Details
Closed on
Aug 19, 2020
Sold by
Ward Melvin R
Bought by
Ward Melvin R and The Melvin R Ward Jr Revocable
Purchase Details
Closed on
May 17, 1999
Sold by
Ward Melvin R and Ward Helen R
Bought by
Ward Melvin R and Ward Helen R
Purchase Details
Closed on
Jan 20, 1999
Sold by
Ward Melvin R and Ward Helen R
Bought by
Ward Melvin R and Ward Helen R
Create a Home Valuation Report for This Property
The Home Valuation Report is an in-depth analysis detailing your home's value as well as a comparison with similar homes in the area
Home Values in the Area
Average Home Value in this Area
Purchase History
| Date | Buyer | Sale Price | Title Company |
|---|---|---|---|
| Yolanda Denson Revocable Living Trust | $266,000 | Old Republic Title | |
| Yolanda Denson Revocable Living Trust | $266,000 | Old Republic Title | |
| Yolanda Denson Revocable Living Trust | -- | Old Republic Title | |
| Yolanda Denson Revocable Living Trust | -- | Old Republic Title | |
| Ward Melvin R | -- | None Available | |
| Ward Melvin R | -- | -- | |
| Ward Melvin R | -- | -- |
Source: Public Records
Tax History
| Year | Tax Paid | Tax Assessment Tax Assessment Total Assessment is a certain percentage of the fair market value that is determined by local assessors to be the total taxable value of land and additions on the property. | Land | Improvement |
|---|---|---|---|---|
| 2025 | $1,844 | $64,619 | $9,775 | $54,844 |
| 2024 | $1,844 | $63,353 | $9,584 | $53,769 |
| 2023 | $1,681 | $62,112 | $9,397 | $52,715 |
| 2022 | $1,677 | $60,895 | $9,214 | $51,681 |
| 2021 | $1,530 | $59,702 | $9,034 | $50,668 |
| 2020 | $1,712 | $59,091 | $8,942 | $50,149 |
| 2019 | $1,593 | $57,933 | $8,767 | $49,166 |
| 2018 | $1,247 | $56,798 | $8,596 | $48,202 |
| 2017 | $1,162 | $55,685 | $8,428 | $47,257 |
| 2016 | $589 | $54,594 | $8,263 | $46,331 |
| 2015 | $581 | $53,775 | $8,139 | $45,636 |
| 2014 | $572 | $52,723 | $7,980 | $44,743 |
Source: Public Records
Map
Nearby Homes
- 816 Grant St
- 942 5th St
- 412 Mclane St
- 615 Mclane St
- 414 Mclane St
- 435 Grant St
- 199 Sandy Beach Rd
- 1012 Pine St
- 9 Sandy Beach Rd
- 121 Lincoln Rd W
- 219 Sea Crest Cir
- 314 San Marcus Dr
- 24 Constance Dr
- 175 Frieda Cir
- 410 San Gabriel Dr Unit 410
- 173 Frieda Cir
- 246 Jordan St
- 173 Jordan St
- 34 Sandy Beach Rd
- 15 Constance Dr
- 349 Winchester St
- 367 Winchester St
- 343 Winchester St
- 377 Winchester St
- 356 Winchester St
- 107 Remington Ct
- 350 Winchester St
- 101 Remington Ct
- 374 Winchester St
- 344 Winchester St
- 337 Winchester St
- 389 Winchester St
- 362 Winchester St
- 368 Winchester St
- 113 Remington Ct
- 338 Winchester St
- 380 Winchester St
- 333 Winchester St
- 386 Winchester St
- 395 Winchester St
Your Personal Tour Guide
Ask me questions while you tour the home.