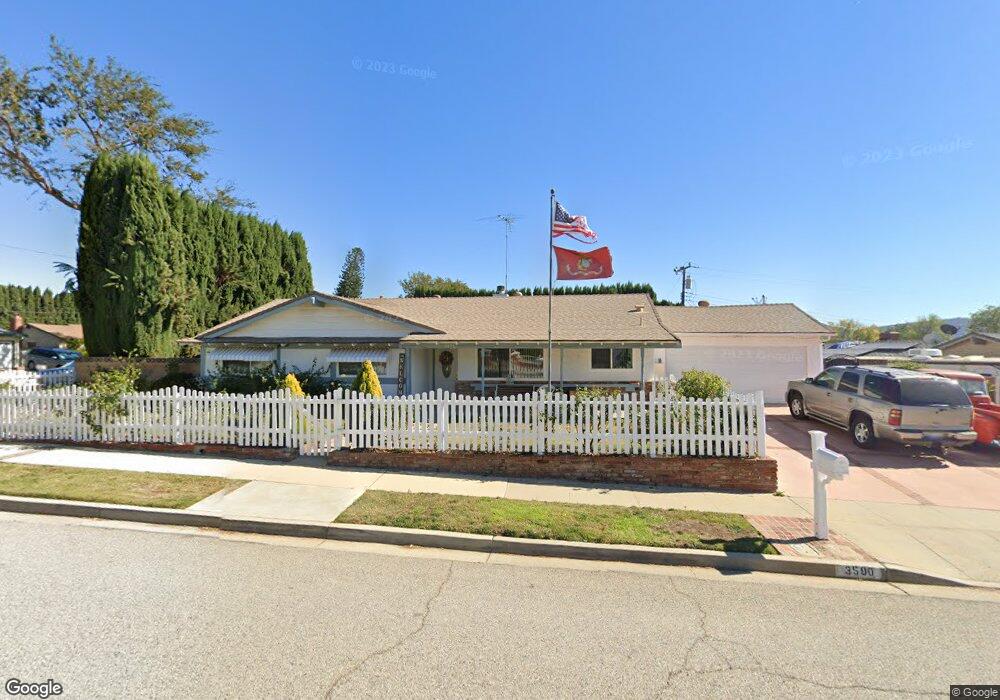
3590 Austin Ave Simi Valley, CA 93063
East Simi Valley NeighborhoodEstimated Value: $859,099 - $904,000
4
Beds
2
Baths
1,612
Sq Ft
$544/Sq Ft
Est. Value
About This Home
This home is located at 3590 Austin Ave, Simi Valley, CA 93063 and is currently estimated at $877,525, approximately $544 per square foot. 3590 Austin Ave is a home located in Ventura County with nearby schools including Big Springs Elementary School, Valley View Middle School, and Simi Valley High School.
Ownership History
Date
Name
Owned For
Owner Type
Purchase Details
Closed on
Sep 2, 2016
Sold by
Chestnut Cosby and Chestnut Laura
Bought by
Chestnut Cosby E and Chestnut Laura D
Current Estimated Value
Purchase Details
Closed on
May 8, 2012
Sold by
Chestnut Cosby and Chestnut Laura
Bought by
Chestnut Cosby and Chestnut Laura
Home Financials for this Owner
Home Financials are based on the most recent Mortgage that was taken out on this home.
Original Mortgage
$233,000
Outstanding Balance
$162,038
Interest Rate
3.98%
Mortgage Type
New Conventional
Estimated Equity
$715,487
Purchase Details
Closed on
Oct 22, 2010
Sold by
Wilson R J
Bought by
Chestnut Crosby and Hineson Laura
Home Financials for this Owner
Home Financials are based on the most recent Mortgage that was taken out on this home.
Original Mortgage
$237,600
Interest Rate
4.23%
Mortgage Type
New Conventional
Purchase Details
Closed on
Jul 22, 1999
Sold by
Wilson Ronald J Lila Lee
Bought by
Wilson R J R and Wilson Lila
Create a Home Valuation Report for This Property
The Home Valuation Report is an in-depth analysis detailing your home's value as well as a comparison with similar homes in the area
Home Values in the Area
Average Home Value in this Area
Purchase History
| Date | Buyer | Sale Price | Title Company |
|---|---|---|---|
| Chestnut Cosby E | -- | None Available | |
| Chestnut Cosby | -- | Lsi Title | |
| Chestnut Crosby | $396,000 | Fidelity National Title | |
| Wilson R J R | -- | -- |
Source: Public Records
Mortgage History
| Date | Status | Borrower | Loan Amount |
|---|---|---|---|
| Open | Chestnut Cosby | $233,000 | |
| Closed | Chestnut Crosby | $237,600 |
Source: Public Records
Tax History Compared to Growth
Tax History
| Year | Tax Paid | Tax Assessment Tax Assessment Total Assessment is a certain percentage of the fair market value that is determined by local assessors to be the total taxable value of land and additions on the property. | Land | Improvement |
|---|---|---|---|---|
| 2025 | $6,190 | $507,327 | $253,665 | $253,662 |
| 2024 | $6,190 | $497,380 | $248,691 | $248,689 |
| 2023 | $5,821 | $487,628 | $243,815 | $243,813 |
| 2022 | $5,797 | $478,067 | $239,034 | $239,033 |
| 2021 | $5,754 | $468,694 | $234,347 | $234,347 |
| 2020 | $5,635 | $463,890 | $231,945 | $231,945 |
| 2019 | $5,379 | $454,796 | $227,398 | $227,398 |
| 2018 | $5,333 | $445,880 | $222,940 | $222,940 |
| 2017 | $5,214 | $437,138 | $218,569 | $218,569 |
| 2016 | $4,980 | $428,568 | $214,284 | $214,284 |
| 2015 | $4,876 | $422,132 | $211,066 | $211,066 |
| 2014 | $4,807 | $413,866 | $206,933 | $206,933 |
Source: Public Records
Map
Nearby Homes
- 4687 Summit Ave
- 4691 Summit Ave
- 4699 Summit Ave
- 3762 Prairie Ridge Ct
- 4679 Summit Ave
- 4683 Summit Ave
- 4984 Corral St
- 3581 Rachael Ave
- 3194 Granville Ave
- 5019 Corral St
- 3586 Lathrop Ave
- 3175 Corpus Christi St
- 3005 Mineral Wells Dr
- 145 Las Llajas Canyon
- 0 Ridge Trail Unit SR21088655
- 3560 Monticello Ave
- 3276 Sunglow Ave
- 3552 Austin Ave
- 4623 Hempstead St
- 3591 Austin Ave
- 4629 Hempstead St
- 3569 Austin Ave
- 3530 Austin Ave
- 4615 Hempstead St
- 3553 Austin Ave
- 4637 Hempstead St
- 3508 Austin Ave
- 3531 Austin Ave
- 3568 Galveston Ave
- 3590 Galveston Ave
- 3552 Galveston Ave
- 4603 Hempstead St
- 4645 Hempstead St
- 3509 Austin Ave
- 3530 Galveston Ave
- 3492 Austin Ave
- 4591 Hempstead St