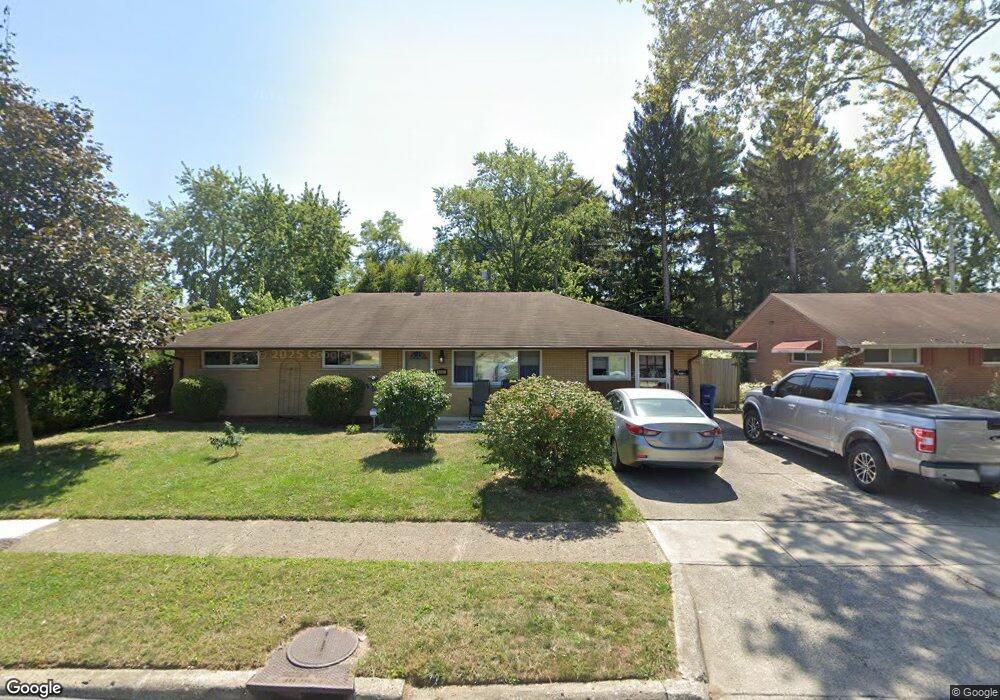
3593 Roswell Dr Columbus, OH 43227
Linwood NeighborhoodEstimated Value: $194,759 - $215,000
3
Beds
2
Baths
1,404
Sq Ft
$147/Sq Ft
Est. Value
About This Home
This home is located at 3593 Roswell Dr, Columbus, OH 43227 and is currently estimated at $205,940, approximately $146 per square foot. 3593 Roswell Dr is a home located in Franklin County with nearby schools including Scottwood Elementary School, Johnson Park Middle School, and Walnut Ridge High School.
Ownership History
Date
Name
Owned For
Owner Type
Purchase Details
Closed on
Apr 7, 2006
Sold by
Kirby Zane M and Kirby Cheree D
Bought by
Green George and Green Lola
Current Estimated Value
Home Financials for this Owner
Home Financials are based on the most recent Mortgage that was taken out on this home.
Original Mortgage
$89,000
Outstanding Balance
$62,269
Interest Rate
10.5%
Mortgage Type
Purchase Money Mortgage
Estimated Equity
$143,671
Purchase Details
Closed on
Jan 12, 2005
Sold by
The Cit Group/Consumer Finance Inc
Bought by
Kirby Zane M
Home Financials for this Owner
Home Financials are based on the most recent Mortgage that was taken out on this home.
Original Mortgage
$48,250
Interest Rate
6.25%
Mortgage Type
Purchase Money Mortgage
Purchase Details
Closed on
Dec 10, 2004
Sold by
Raffeld Harold A and Case #03Cve10 11024
Bought by
The Cit Group/Consumer Finance Inc
Home Financials for this Owner
Home Financials are based on the most recent Mortgage that was taken out on this home.
Original Mortgage
$48,250
Interest Rate
6.25%
Mortgage Type
Purchase Money Mortgage
Purchase Details
Closed on
Mar 26, 1973
Bought by
Raffeld Howard A
Create a Home Valuation Report for This Property
The Home Valuation Report is an in-depth analysis detailing your home's value as well as a comparison with similar homes in the area
Home Values in the Area
Average Home Value in this Area
Purchase History
| Date | Buyer | Sale Price | Title Company |
|---|---|---|---|
| Green George | $89,000 | Talon Group | |
| Kirby Zane M | $64,800 | Chicago Tit | |
| The Cit Group/Consumer Finance Inc | $65,000 | -- | |
| Raffeld Howard A | -- | -- |
Source: Public Records
Mortgage History
| Date | Status | Borrower | Loan Amount |
|---|---|---|---|
| Open | Green George | $89,000 | |
| Closed | Kirby Zane M | $48,250 |
Source: Public Records
Tax History Compared to Growth
Tax History
| Year | Tax Paid | Tax Assessment Tax Assessment Total Assessment is a certain percentage of the fair market value that is determined by local assessors to be the total taxable value of land and additions on the property. | Land | Improvement |
|---|---|---|---|---|
| 2024 | $2,463 | $54,880 | $13,860 | $41,020 |
| 2023 | $2,432 | $54,880 | $13,860 | $41,020 |
| 2022 | $1,493 | $28,780 | $8,230 | $20,550 |
| 2021 | $1,495 | $28,780 | $8,230 | $20,550 |
| 2020 | $1,497 | $28,780 | $8,230 | $20,550 |
| 2019 | $1,444 | $23,800 | $6,860 | $16,940 |
| 2018 | $1,379 | $23,800 | $6,860 | $16,940 |
| 2017 | $1,447 | $23,800 | $6,860 | $16,940 |
| 2016 | $1,451 | $21,910 | $5,600 | $16,310 |
| 2015 | $1,318 | $21,910 | $5,600 | $16,310 |
| 2014 | $1,321 | $21,910 | $5,600 | $16,310 |
| 2013 | $724 | $24,360 | $6,230 | $18,130 |
Source: Public Records
Map
Nearby Homes
- 1836 Penfield Ct S
- 3566 Seabrook Ave
- 3325 E Deshler Ave
- 3861 Gilroy Rd
- 1721 Bostwick Rd
- 1664 Barnett Rd
- 3246 E Deshler Ave
- 1656 Vilardo Ln
- 1640 Striebel Rd
- 1624 Miltwood Rd
- 1635 Elaine Rd
- 1294 Dellwood Ave
- 1252 Carolwood Ave
- 1254 Elderwood Ave
- 1271 S Weyant Ave
- 1490 Elaine Rd Unit 1462
- 1778 Quigley Rd
- 1220 Elderwood Ave
- 3563 Astor Ave
- 3084 Clermont Rd
- 3603 Roswell Dr
- 3585 Roswell Dr
- 3575 Roswell Dr
- 3611 Roswell Dr
- 3606 Roswell Dr
- 1633 Cunard Rd
- 3572 LIV Moor Dr
- 3566 LIV Moor Dr
- 3567 Roswell Dr
- 1665 Courtright Rd
- 3578 Roswell Dr
- 3560 LIV Moor Dr
- 1632 Cunard Rd
- 3620 Roswell Dr
- 1623 Cunard Rd
- 3578 LIV Moor Dr
- 1681 Courtright Rd
- 3554 LIV Moor Dr
- 3568 Roswell Dr
- 3586 LIV Moor Dr