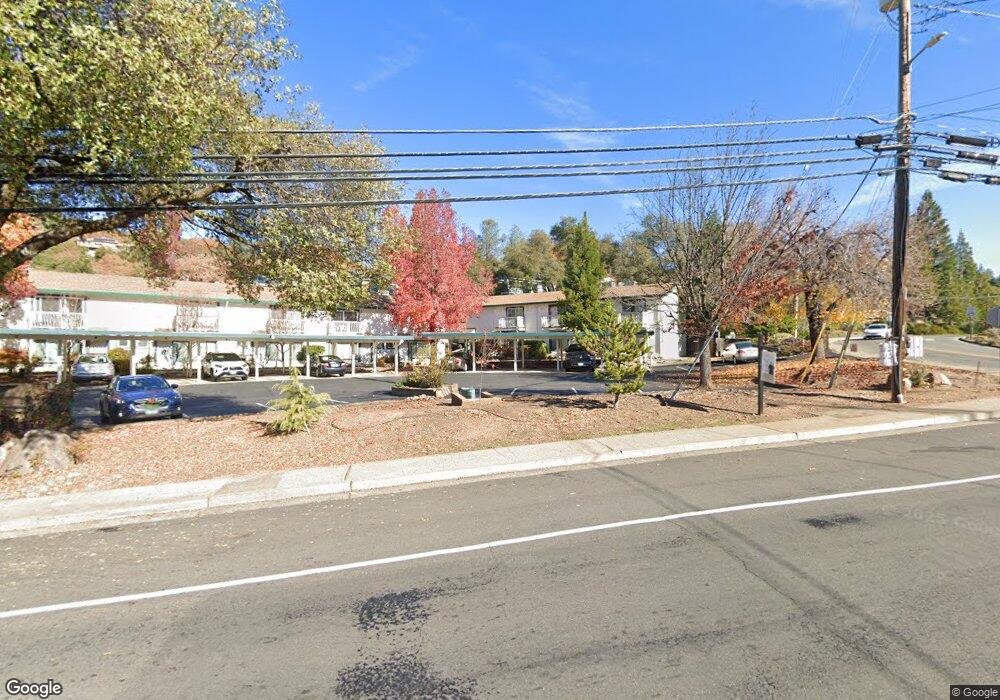
3595 Cedar Ravine Rd Placerville, CA 95667
Estimated Value: $285,000 - $387,000
2
Beds
2
Baths
960
Sq Ft
$331/Sq Ft
Est. Value
About This Home
This home is located at 3595 Cedar Ravine Rd, Placerville, CA 95667 and is currently estimated at $317,714, approximately $330 per square foot. 3595 Cedar Ravine Rd is a home located in El Dorado County with nearby schools including El Dorado High School and El Dorado Adventist School.
Ownership History
Date
Name
Owned For
Owner Type
Purchase Details
Closed on
Oct 9, 2020
Sold by
Morrison Lorraine M and The Dd And Lm Morrison Survivo
Bought by
Tian Cheng Yi
Current Estimated Value
Purchase Details
Closed on
Jan 27, 2012
Sold by
Morrison Lorraine M and D D & L M Morrison Family Revo
Bought by
Morrison Lorraine M and Dd & Lm Morrison Survivors Tru
Purchase Details
Closed on
Oct 24, 2000
Sold by
Douglass Eugene S
Bought by
Morrison Donald D and Morrison Lorraine N
Purchase Details
Closed on
Dec 3, 1999
Sold by
Douglass Eugene S
Bought by
Douglass Eugene S and Eugene S Douglass Separate Pro
Purchase Details
Closed on
Dec 6, 1996
Sold by
Douglass E Joyce
Bought by
Douglass Eugene S
Purchase Details
Closed on
Mar 24, 1994
Sold by
Douglass E Joyce
Bought by
Douglass Eugene S
Create a Home Valuation Report for This Property
The Home Valuation Report is an in-depth analysis detailing your home's value as well as a comparison with similar homes in the area
Home Values in the Area
Average Home Value in this Area
Purchase History
| Date | Buyer | Sale Price | Title Company |
|---|---|---|---|
| Tian Cheng Yi | $220,000 | Fidelity Natl Ttl Co Of Ca | |
| Morrison Lorraine M | -- | None Available | |
| Morrison Donald D | $80,000 | Fidelity National Title | |
| Douglass Eugene S | -- | -- | |
| Douglass Eugene S | -- | -- | |
| Douglass Eugene S | -- | -- |
Source: Public Records
Tax History
| Year | Tax Paid | Tax Assessment Tax Assessment Total Assessment is a certain percentage of the fair market value that is determined by local assessors to be the total taxable value of land and additions on the property. | Land | Improvement |
|---|---|---|---|---|
| 2025 | $2,486 | $238,134 | $54,121 | $184,013 |
| 2024 | $2,486 | $233,465 | $53,060 | $180,405 |
| 2023 | $2,438 | $228,888 | $52,020 | $176,868 |
| 2022 | $2,423 | $224,400 | $51,000 | $173,400 |
| 2021 | $2,396 | $220,000 | $50,000 | $170,000 |
| 2020 | $1,217 | $110,197 | $30,298 | $79,899 |
| 2019 | $1,202 | $108,037 | $29,704 | $78,333 |
| 2018 | $1,167 | $105,920 | $29,122 | $76,798 |
| 2017 | $1,150 | $103,844 | $28,551 | $75,293 |
| 2016 | $1,133 | $101,809 | $27,992 | $73,817 |
| 2015 | $1,083 | $100,281 | $27,572 | $72,709 |
| 2014 | $1,083 | $98,319 | $27,033 | $71,286 |
Source: Public Records
Map
Nearby Homes
- 1531 Jeffrey Ln
- 3550 Eskaton Dr
- 1030 Lemongrass Ct
- 1764 Country Club Dr
- 3930 Cedar Ravine Rd
- 2500 N View Ln
- 3237 Francis Ave
- 1720 Jacobs Way
- 1812 Mary Ct
- 3166 Cedar Ravine Rd
- 949 Bliss Ct
- 3095 Cedar Ravine Rd
- 678 Main St
- 2977 Mosquito Rd
- 3254 Clark St
- 899 Estey Way
- 3353 Airport Rd
- 3113 Clark St
- 3124 Clark St
- 5 Estey Way
- 3597 Cedar Ravine Rd
- 3593 Cedar Ravine Rd
- 3599 Cedar Ravine Rd Unit 1
- 3599 Cedar Ravine Rd
- 3599 Cedar Ravine Rd
- 3591 Cedar Ravine Rd
- 3601 Cedar Ravine Rd Unit 14
- 3589 Cedar Ravine Rd
- 1385 Country Club Dr
- 1510 Jeffrey Ln
- 1508 Jeffrey Ln
- 3587 Cedar Ravine Rd
- 1516 Jeffrey Ln
- 1506 Jeffrey Ln
- 3585 Cedar Ravine Rd
- 1518 Jeffrey Ln
- 3583 Cedar Ravine Rd
- 1500 Jeffrey Ln
- 3581 Cedar Ravine Rd
- 1536 Jeffrey Ln
Your Personal Tour Guide
Ask me questions while you tour the home.