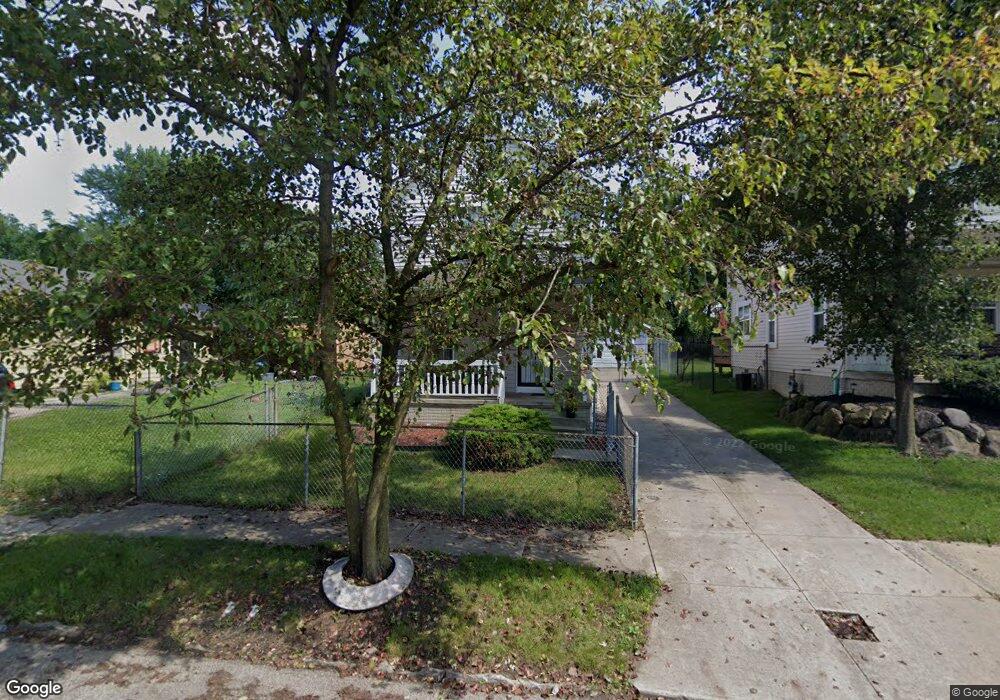
3595 E 81st St Cleveland, OH 44105
Slavic Village NeighborhoodEstimated Value: $68,000 - $104,000
4
Beds
2
Baths
1,296
Sq Ft
$71/Sq Ft
Est. Value
About This Home
This home is located at 3595 E 81st St, Cleveland, OH 44105 and is currently estimated at $92,219, approximately $71 per square foot. 3595 E 81st St is a home with nearby schools including Anton Grdina School, Bolton, and Andrew J. Rickoff School.
Ownership History
Date
Name
Owned For
Owner Type
Purchase Details
Closed on
Nov 9, 2012
Sold by
Cleveland Housing Network Inc
Bought by
Parkham Keith C
Current Estimated Value
Home Financials for this Owner
Home Financials are based on the most recent Mortgage that was taken out on this home.
Original Mortgage
$8,000
Outstanding Balance
$5,523
Interest Rate
3.37%
Mortgage Type
Future Advance Clause Open End Mortgage
Estimated Equity
$86,696
Purchase Details
Closed on
Jan 3, 2011
Sold by
Cleveland Housing Network Limited Partne
Bought by
Cleveland Housing Network Inc
Purchase Details
Closed on
May 24, 1994
Sold by
Denise Joyce
Bought by
Cleveland ,City Of Lb94
Purchase Details
Closed on
Apr 3, 1985
Sold by
William C Ogilvie
Bought by
Jerry and Denise Joyce
Purchase Details
Closed on
Jul 21, 1978
Sold by
Ogilvie William and Ogilvie Ann
Bought by
Ogilvie William
Purchase Details
Closed on
Jan 1, 1975
Bought by
Ogilvie William and Ogilvie Ann
Create a Home Valuation Report for This Property
The Home Valuation Report is an in-depth analysis detailing your home's value as well as a comparison with similar homes in the area
Home Values in the Area
Average Home Value in this Area
Purchase History
| Date | Buyer | Sale Price | Title Company |
|---|---|---|---|
| Parkham Keith C | $25,750 | American Family Title Age | |
| Cleveland Housing Network Inc | -- | Attorney | |
| Cleveland ,City Of Lb94 | -- | -- | |
| Jerry | $15,000 | -- | |
| William C Ogilvie | -- | -- | |
| Ogilvie William | -- | -- | |
| Ogilvie William | -- | -- |
Source: Public Records
Mortgage History
| Date | Status | Borrower | Loan Amount |
|---|---|---|---|
| Open | Parkham Keith C | $8,000 | |
| Open | Parkham Keith C | $19,205 |
Source: Public Records
Tax History Compared to Growth
Tax History
| Year | Tax Paid | Tax Assessment Tax Assessment Total Assessment is a certain percentage of the fair market value that is determined by local assessors to be the total taxable value of land and additions on the property. | Land | Improvement |
|---|---|---|---|---|
| 2024 | $2,017 | $30,765 | $3,080 | $27,685 |
| 2023 | $1,883 | $24,820 | $2,380 | $22,440 |
| 2022 | $1,872 | $24,815 | $2,380 | $22,435 |
| 2021 | $1,853 | $24,820 | $2,380 | $22,440 |
| 2020 | $1,880 | $21,770 | $2,100 | $19,670 |
| 2019 | $1,738 | $62,200 | $6,000 | $56,200 |
| 2018 | $1,264 | $21,770 | $2,100 | $19,670 |
| 2017 | $802 | $9,730 | $1,820 | $7,910 |
| 2016 | $796 | $9,730 | $1,820 | $7,910 |
| 2015 | $2,389 | $9,730 | $1,820 | $7,910 |
| 2014 | $2,389 | $9,730 | $1,820 | $7,910 |
Source: Public Records
Map
Nearby Homes
- 3553 E 76th St
- 3511 E 78th St
- 3606 E 75th St
- 3554 E 72nd St
- 3477 E 89th St
- 3473 E 89th St
- 3430 E 73rd St
- 7107 Ivy Ave
- 7427 Spafford Rd
- 9400 Orleans Ave
- 6729 Forman Ave
- 9411 Beacon Ave
- 9107 Laisy Ave
- 6719 Forman Ave
- 9501 Anderson Ave
- 7738 Spafford Rd
- 6901 Fullerton Ave
- 9615 Dunlap Ave
- 9409 Raymond Ave
- 9622 Aetna Rd