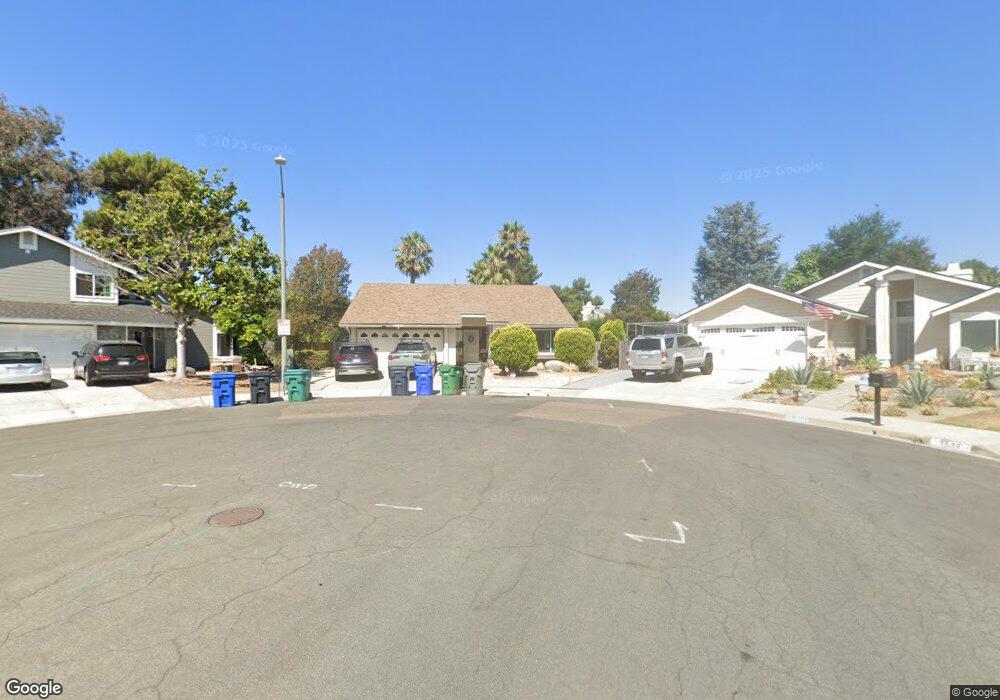
3598 Normount Rd Oceanside, CA 92056
Ocean Hills NeighborhoodEstimated Value: $732,000 - $1,015,000
3
Beds
2
Baths
1,495
Sq Ft
$580/Sq Ft
Est. Value
About This Home
This home is located at 3598 Normount Rd, Oceanside, CA 92056 and is currently estimated at $866,903, approximately $579 per square foot. 3598 Normount Rd is a home located in San Diego County with nearby schools including Lake Elementary School, Madison Middle School, and Rancho Buena Vista High School.
Ownership History
Date
Name
Owned For
Owner Type
Purchase Details
Closed on
Jul 5, 2013
Sold by
Lopresti Gene J and Lopresti Elaine M
Bought by
Lopresti Gene J and Lopresti Elaine M
Current Estimated Value
Purchase Details
Closed on
Jun 8, 2012
Sold by
Presti Gene Charls Lo
Bought by
Presti Gene Joseph Lo
Purchase Details
Closed on
May 13, 1994
Sold by
Lopresti Gene C and Lopresti Joan J
Bought by
Lopresti Gene C and Lopresti Joan J
Purchase Details
Closed on
Jul 11, 1983
Create a Home Valuation Report for This Property
The Home Valuation Report is an in-depth analysis detailing your home's value as well as a comparison with similar homes in the area
Home Values in the Area
Average Home Value in this Area
Purchase History
| Date | Buyer | Sale Price | Title Company |
|---|---|---|---|
| Lopresti Gene J | -- | None Available | |
| Lopresti Gene J | -- | None Available | |
| Lopresti Gene Joseph | -- | None Available | |
| Presti Gene Joseph Lo | -- | None Available | |
| Lopresti Gene C | -- | -- | |
| -- | $133,900 | -- |
Source: Public Records
Tax History
| Year | Tax Paid | Tax Assessment Tax Assessment Total Assessment is a certain percentage of the fair market value that is determined by local assessors to be the total taxable value of land and additions on the property. | Land | Improvement |
|---|---|---|---|---|
| 2025 | $3,062 | $277,382 | $103,576 | $173,806 |
| 2024 | $3,062 | $271,945 | $101,546 | $170,399 |
| 2023 | $2,990 | $266,613 | $99,555 | $167,058 |
| 2022 | $2,982 | $261,386 | $97,603 | $163,783 |
| 2021 | $2,918 | $256,262 | $95,690 | $160,572 |
| 2020 | $2,908 | $253,635 | $94,709 | $158,926 |
| 2019 | $2,867 | $248,662 | $92,852 | $155,810 |
| 2018 | $2,729 | $243,787 | $91,032 | $152,755 |
| 2017 | $70 | $239,008 | $89,248 | $149,760 |
| 2016 | $2,617 | $234,323 | $87,499 | $146,824 |
| 2015 | $2,607 | $230,804 | $86,185 | $144,619 |
| 2014 | $2,545 | $226,284 | $84,497 | $141,787 |
Source: Public Records
Map
Nearby Homes
- 1603 Laurelwood Way
- 4912 Colusa Dr
- 4566 Hancock Cir
- 1522 Sunset Dr
- 3563 Turquoise Ln
- 3643 Merced Dr
- 4470 Sapphire Ln
- 0 Hedionda Ave
- 157 Horizon Ln
- 120 Brookside Ln
- 101 Havenview Ln
- 65 Brookside Ln
- 42 Havenview Ln
- 4359 Serena Ave
- 1863 Sunset Dr
- 1937 Sunset Dr
- 4528 Cordoba Way
- 601 Marazon Ln
- 1192 Via Santa Paulo
- 647 Via Costa Rica
- 3596 Normount Rd
- 3598 Keystone Cir
- 3599 Normount Rd
- 3596 Keystone Cir
- 3594 Normount Rd
- 3597 Normount Rd
- 3599 Keystone Cir
- 3595 Normount Rd
- 3594 Keystone Cir
- 4635 Waverly Rd
- 4639 Waverly Rd
- 3593 Normount Rd
- 3597 Keystone Cir
- 3592 Keystone Cir
- 4627 Waverly Rd
- 4619 Waverly Rd
- 4615 Waverly Rd
- 4623 Waverly Rd
- 3595 Keystone Cir
- 3593 Keystone Cir
Your Personal Tour Guide
Ask me questions while you tour the home.