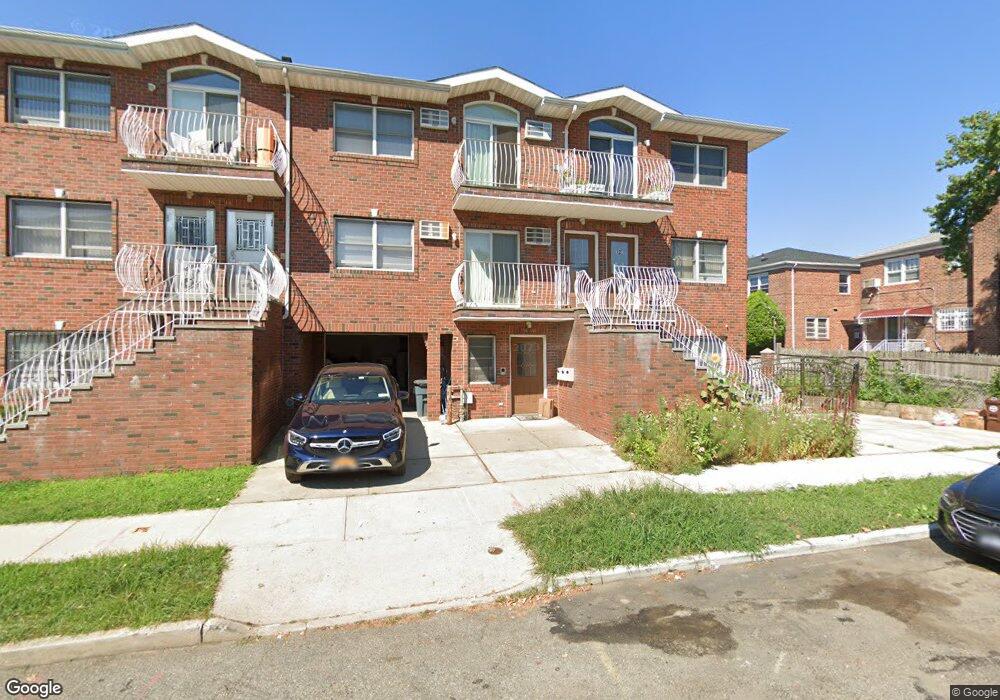
36-12 193rd St Unit 3F Flushing, NY 11358
Auburndale NeighborhoodEstimated Value: $1,358,000 - $1,804,000
--
Bed
2
Baths
2,184
Sq Ft
$728/Sq Ft
Est. Value
About This Home
This home is located at 36-12 193rd St Unit 3F, Flushing, NY 11358 and is currently estimated at $1,590,771, approximately $728 per square foot. 36-12 193rd St Unit 3F is a home located in Queens County with nearby schools including P.S. 32 - State Street, I.S. 25 Adrien Block, and Francis Lewis High School.
Ownership History
Date
Name
Owned For
Owner Type
Purchase Details
Closed on
Sep 13, 2007
Sold by
125Th Street Corp
Bought by
Xu Wan Yao and Zhang Shao Yan
Current Estimated Value
Home Financials for this Owner
Home Financials are based on the most recent Mortgage that was taken out on this home.
Original Mortgage
$410,000
Outstanding Balance
$258,265
Interest Rate
6.65%
Mortgage Type
Purchase Money Mortgage
Estimated Equity
$1,332,506
Purchase Details
Closed on
May 16, 2006
Sold by
Wu Huiyan and Wu Ling
Bought by
125Th Street Corp
Purchase Details
Closed on
Feb 24, 2005
Sold by
Callahan Francis and Callahan John
Bought by
Wu Huiyan and Wu Ling
Home Financials for this Owner
Home Financials are based on the most recent Mortgage that was taken out on this home.
Original Mortgage
$162,750
Interest Rate
5.64%
Purchase Details
Closed on
Oct 11, 1994
Sold by
Horner William R and Callahan Kathleen C
Bought by
Horner Andrew William and Horner Catherine Edith
Create a Home Valuation Report for This Property
The Home Valuation Report is an in-depth analysis detailing your home's value as well as a comparison with similar homes in the area
Home Values in the Area
Average Home Value in this Area
Purchase History
| Date | Buyer | Sale Price | Title Company |
|---|---|---|---|
| Xu Wan Yao | $982,611 | -- | |
| Xu Wan Yao | $982,611 | -- | |
| 125Th Street Corp | $860,000 | -- | |
| 125Th Street Corp | $860,000 | -- | |
| Wu Huiyan | $653,000 | -- | |
| Wu Huiyan | $653,000 | -- | |
| Horner Andrew William | -- | Ticor Title Guarantee Compan | |
| Horner Andrew William | -- | Ticor Title Guarantee Compan |
Source: Public Records
Mortgage History
| Date | Status | Borrower | Loan Amount |
|---|---|---|---|
| Open | Xu Wan Yao | $410,000 | |
| Closed | Xu Wan Yao | $410,000 | |
| Previous Owner | Wu Huiyan | $162,750 | |
| Previous Owner | Wu Huiyan | $359,650 |
Source: Public Records
Tax History Compared to Growth
Tax History
| Year | Tax Paid | Tax Assessment Tax Assessment Total Assessment is a certain percentage of the fair market value that is determined by local assessors to be the total taxable value of land and additions on the property. | Land | Improvement |
|---|---|---|---|---|
| 2025 | $14,354 | $74,040 | $30,204 | $43,836 |
| 2024 | $14,354 | $71,468 | $29,036 | $42,432 |
| 2023 | $13,542 | $67,423 | $26,306 | $41,117 |
| 2022 | $11,381 | $79,500 | $29,520 | $49,980 |
| 2021 | $9,742 | $76,920 | $29,520 | $47,400 |
| 2020 | $7,295 | $83,640 | $29,520 | $54,120 |
| 2019 | $5,061 | $89,220 | $29,520 | $59,700 |
| 2018 | $3,129 | $56,186 | $23,230 | $32,956 |
| 2017 | $3,129 | $56,186 | $25,478 | $30,708 |
| 2016 | $3,069 | $56,186 | $25,478 | $30,708 |
| 2015 | $2,096 | $52,608 | $28,950 | $23,658 |
| 2014 | $2,096 | $49,631 | $28,942 | $20,689 |
Source: Public Records
Map
Nearby Homes
- 36-20 194th St Unit 3r
- 3617 194th St
- 191-9 39th Ave Unit 164
- 191-09 39th Ave Unit Lower
- 191-22 39th Ave
- 190-05 39th Ave Unit 140
- 190-05 39th Ave Unit 142
- 194-23 Station Rd
- 36-20 190th St
- 195-31 39th Ave
- 37-02 Francis Lewis Blvd
- 37-08 Francis Lewis Blvd
- 37-6 Francis Lewis Blvd
- 191-08 Station Rd
- 19112 Station Rd
- 189-23 39th Ave Unit 122
- 4014 191st St
- 40-38 194th St Unit A-1
- 36- 40 201st St Unit A, B, C
- 19934 34th Ave
- 36-16 193rd St Unit 2 Fl
- 36-16 193rd St Unit 2nd Fl
- 36-16 193rd St Unit 3
- 36-16 193rd St
- 3612 193rd St
- 3616 193rd St
- 3618 193rd St
- 3622 193rd St
- 19218 Crocheron Ave
- 19220 Crocheron Ave
- 19214 Crocheron Ave
- 19212 Crocheron Ave
- 19208 Crocheron Ave
- 3615 192nd St
- 3621 193rd St Unit 3E
- 3621 193rd St Unit 3D
- 3621 193rd St Unit 3C
- 3621 193rd St Unit 3B
- 3621 193rd St Unit 3A
- 3621 193rd St Unit 2E