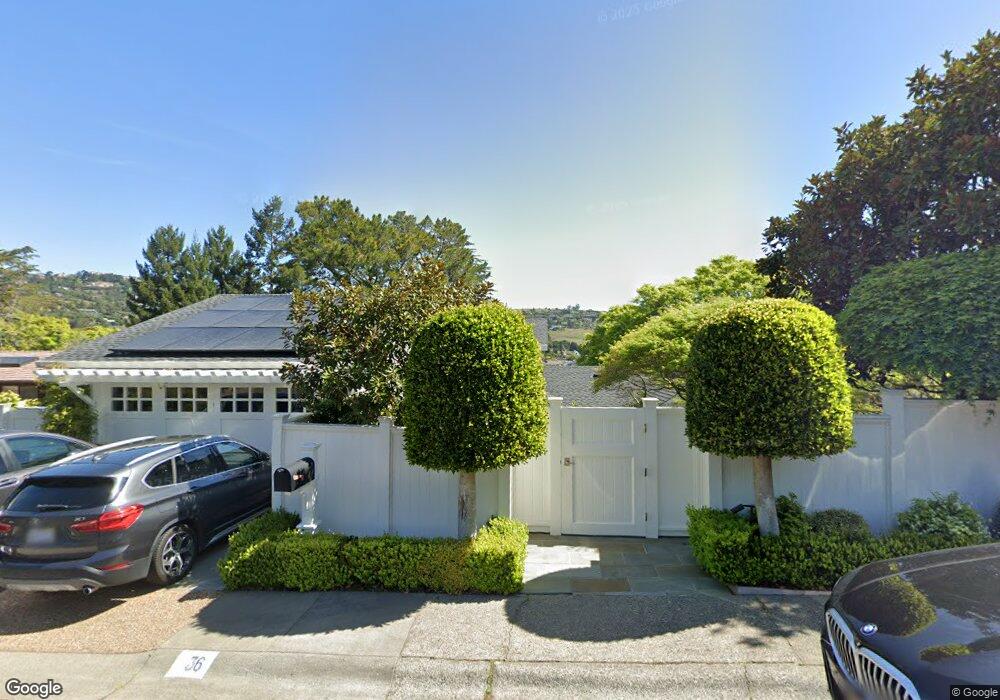
36 Bayview Ave Belvedere Tiburon, CA 94920
Belvedere NeighborhoodEstimated Value: $4,306,000 - $4,682,000
5
Beds
4
Baths
3,069
Sq Ft
$1,442/Sq Ft
Est. Value
About This Home
This home is located at 36 Bayview Ave, Belvedere Tiburon, CA 94920 and is currently estimated at $4,426,157, approximately $1,442 per square foot. 36 Bayview Ave is a home located in Marin County with nearby schools including Reed Elementary School, Bel Aire Elementary School, and Del Mar Middle School.
Ownership History
Date
Name
Owned For
Owner Type
Purchase Details
Closed on
Sep 15, 2014
Sold by
Acker Robert and Castro Christine
Bought by
Acker Family Trust and Acker Christine C
Current Estimated Value
Home Financials for this Owner
Home Financials are based on the most recent Mortgage that was taken out on this home.
Original Mortgage
$1,000,000
Outstanding Balance
$764,433
Interest Rate
4.1%
Mortgage Type
New Conventional
Estimated Equity
$3,661,724
Purchase Details
Closed on
Oct 3, 2006
Sold by
Acker Robert and Acker Christine
Bought by
Acker Robert M and Acker Christine C
Purchase Details
Closed on
Feb 1, 2006
Sold by
Funston Kathleen E
Bought by
Acker Robert and Acker Christine
Home Financials for this Owner
Home Financials are based on the most recent Mortgage that was taken out on this home.
Original Mortgage
$1,000,000
Interest Rate
6.25%
Mortgage Type
Fannie Mae Freddie Mac
Purchase Details
Closed on
May 24, 2004
Sold by
Funston Louis
Bought by
Heritage Trust Co and Ellis Robert S
Purchase Details
Closed on
Jun 6, 2003
Sold by
Funston Louis and Funston Kathleen E
Bought by
Funston Louis
Create a Home Valuation Report for This Property
The Home Valuation Report is an in-depth analysis detailing your home's value as well as a comparison with similar homes in the area
Home Values in the Area
Average Home Value in this Area
Purchase History
| Date | Buyer | Sale Price | Title Company |
|---|---|---|---|
| Acker Family Trust | -- | Old Republic Title Company | |
| Acker Robert | -- | Old Republic Title Company | |
| Acker Robert M | -- | None Available | |
| Acker Robert | $2,050,000 | Fidelity National Title Co | |
| Heritage Trust Co | -- | -- | |
| Funston Louis | -- | -- |
Source: Public Records
Mortgage History
| Date | Status | Borrower | Loan Amount |
|---|---|---|---|
| Open | Acker Robert | $1,000,000 | |
| Closed | Acker Robert | $1,000,000 |
Source: Public Records
Tax History Compared to Growth
Tax History
| Year | Tax Paid | Tax Assessment Tax Assessment Total Assessment is a certain percentage of the fair market value that is determined by local assessors to be the total taxable value of land and additions on the property. | Land | Improvement |
|---|---|---|---|---|
| 2025 | $43,098 | $3,525,161 | $1,913,044 | $1,612,117 |
| 2024 | $43,098 | $3,456,048 | $1,875,538 | $1,580,510 |
| 2023 | $42,176 | $3,388,303 | $1,838,774 | $1,549,529 |
| 2022 | $41,765 | $3,321,872 | $1,802,724 | $1,519,148 |
| 2021 | $41,170 | $3,256,755 | $1,767,388 | $1,489,367 |
| 2020 | $40,824 | $3,223,373 | $1,749,272 | $1,474,101 |
| 2019 | $40,081 | $3,160,192 | $1,714,986 | $1,445,206 |
| 2018 | $39,344 | $3,098,252 | $1,681,372 | $1,416,880 |
| 2017 | $38,878 | $3,037,519 | $1,648,416 | $1,389,103 |
| 2016 | $37,370 | $2,977,974 | $1,616,104 | $1,361,870 |
| 2015 | $30,963 | $2,327,500 | $1,591,842 | $735,658 |
| 2014 | $29,919 | $2,275,472 | $1,556,259 | $719,213 |
Source: Public Records
Map
Nearby Homes
- 329 San Rafael Ave
- 1 N Point Cir
- 11 Crest Rd
- 27 W Shore Rd
- 9 Edgewater Rd
- 72 Lagoon Rd
- 22 Eucalyptus Rd
- 97 W Shore Rd
- 1206 Mariner Way
- 15 Harbor Oak Dr Unit 12
- 135 Belvedere Ave
- 0 Belvedere Ave
- 45 Corinthian Ct Unit 32
- 3 Bellevue Ave
- 45 Harbor Oak Dr Unit 14
- 84 Eastview Ave
- 304 Golden Gate Ave
- 335 Golden Gate Ave
- 308 Golden Gate Ave
- 6 Red Hill Cir Unit 3
- 40 Bayview Ave
- 32 Bayview Ave
- 42 Bayview Ave
- 321 San Rafael Ave
- 28 Bayview Ave
- 319 San Rafael Ave
- 323 San Rafael Ave
- 35 Bayview Ave
- 317 San Rafael Ave
- 33 Bayview Ave
- 325 San Rafael Ave
- 46 Bayview Ave
- 24 Bayview Ave
- 8 Buckeye Rd
- 315 San Rafael Ave
- 29 Bayview Ave
- 327 San Rafael Ave
- 10 Buckeye Rd
- 313 San Rafael Ave
- 50 Bayview Ave