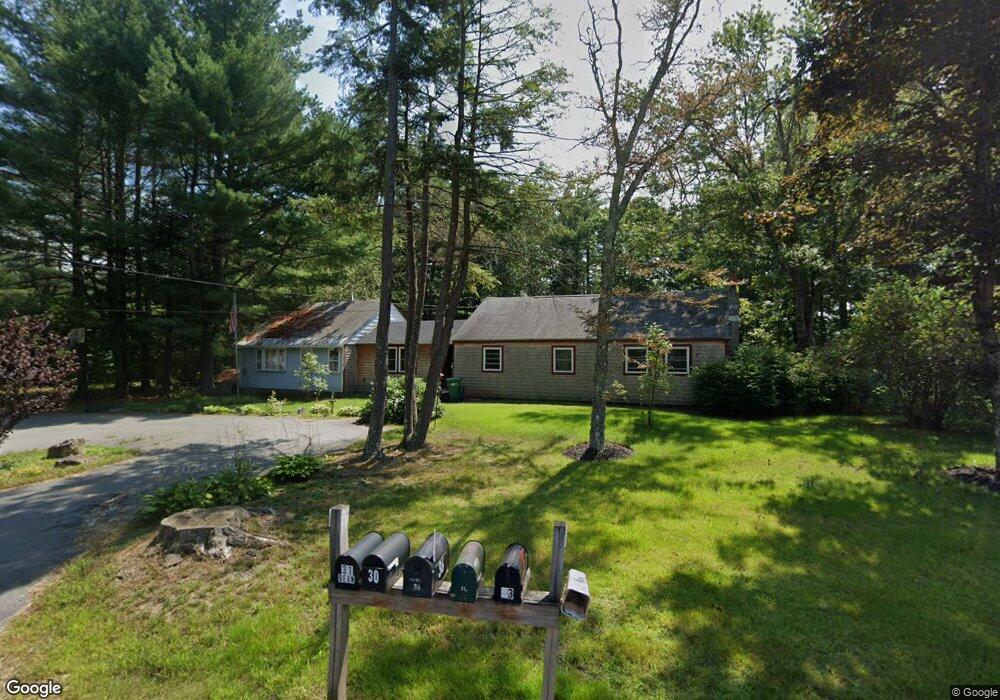
36 Bean Rd Fremont, NH 03044
Estimated Value: $461,776 - $541,000
2
Beds
2
Baths
1,665
Sq Ft
$304/Sq Ft
Est. Value
About This Home
This home is located at 36 Bean Rd, Fremont, NH 03044 and is currently estimated at $506,194, approximately $304 per square foot. 36 Bean Rd is a home located in Rockingham County with nearby schools including Ellis School.
Ownership History
Date
Name
Owned For
Owner Type
Purchase Details
Closed on
Nov 14, 2013
Sold by
Keeler Scott L and Keeler Misty M
Bought by
Keeler Scott L and Keeler Misty M
Current Estimated Value
Home Financials for this Owner
Home Financials are based on the most recent Mortgage that was taken out on this home.
Original Mortgage
$139,600
Outstanding Balance
$104,148
Interest Rate
4.24%
Mortgage Type
Purchase Money Mortgage
Estimated Equity
$402,046
Purchase Details
Closed on
Oct 28, 1994
Bought by
Keeler Scott L and Keeler Misty M
Create a Home Valuation Report for This Property
The Home Valuation Report is an in-depth analysis detailing your home's value as well as a comparison with similar homes in the area
Home Values in the Area
Average Home Value in this Area
Purchase History
| Date | Buyer | Sale Price | Title Company |
|---|---|---|---|
| Keeler Scott L | -- | -- | |
| Keeler Scott L | -- | -- |
Source: Public Records
Mortgage History
| Date | Status | Borrower | Loan Amount |
|---|---|---|---|
| Open | Keeler Scott L | $139,600 | |
| Previous Owner | Keeler Scott L | $20,000 | |
| Previous Owner | Keeler Scott L | $150,000 |
Source: Public Records
Tax History Compared to Growth
Tax History
| Year | Tax Paid | Tax Assessment Tax Assessment Total Assessment is a certain percentage of the fair market value that is determined by local assessors to be the total taxable value of land and additions on the property. | Land | Improvement |
|---|---|---|---|---|
| 2024 | $5,973 | $226,500 | $120,200 | $106,300 |
| 2023 | $5,343 | $226,500 | $120,200 | $106,300 |
| 2022 | $5,253 | $226,500 | $120,200 | $106,300 |
| 2021 | $5,093 | $228,200 | $120,200 | $108,000 |
| 2020 | $5,278 | $228,200 | $120,200 | $108,000 |
| 2019 | $6,480 | $208,700 | $85,400 | $123,300 |
| 2018 | $6,136 | $208,700 | $85,400 | $123,300 |
| 2017 | $6,092 | $208,700 | $85,400 | $123,300 |
| 2016 | $6,251 | $209,200 | $85,400 | $123,800 |
| 2015 | $6,067 | $209,200 | $85,400 | $123,800 |
| 2014 | $5,715 | $202,500 | $85,400 | $117,100 |
| 2013 | $5,773 | $202,500 | $85,400 | $117,100 |
Source: Public Records
Map
Nearby Homes
- 30 Tibbetts Rd
- 14 River Rd
- 17 Edgewater Dr Unit 26
- 13 Edgewater Dr Unit 24
- 12 Hub Hollow Rd
- 24 Rim Rd
- 18 Edgewater Dr Unit 33
- 19 Edgewater Dr Unit 27
- 25 Edgewater Dr
- 24 Edgewater Dr
- 15 Edgewater Dr
- 26 Edgewater Dr
- 23 Edgewater Dr Unit 29
- 16 Edgewater Dr Unit 34
- 11 Edgewater Dr Unit 23
- 14 Edgewater Dr Unit 31
- Lot G Longview Place
- 8 Taylor Cir Unit 12
- 8 Stone Creek Dr
- 9 Stone Creek Dr