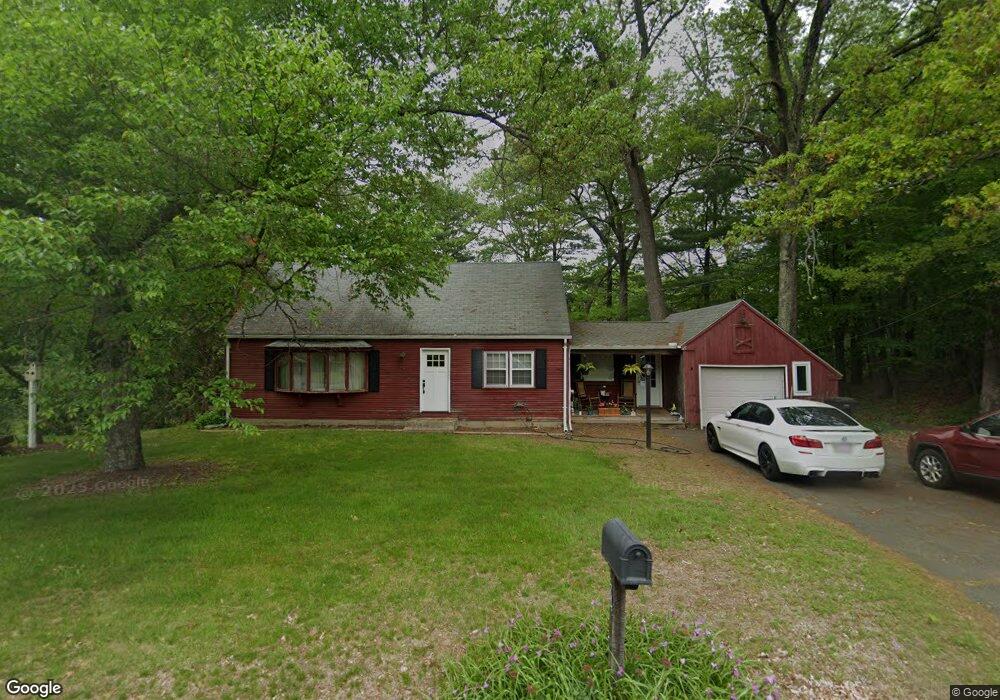
36 Cedar Ln Westfield, MA 01085
Estimated Value: $383,401 - $474,000
3
Beds
2
Baths
1,666
Sq Ft
$259/Sq Ft
Est. Value
About This Home
This home is located at 36 Cedar Ln, Westfield, MA 01085 and is currently estimated at $431,100, approximately $258 per square foot. 36 Cedar Ln is a home located in Hampden County with nearby schools including Westfield High School and Saint Mary High School.
Ownership History
Date
Name
Owned For
Owner Type
Purchase Details
Closed on
Sep 20, 1999
Sold by
Gannon John B and Gannon Debra L
Bought by
Gilmore Donna M and Green Martin J
Current Estimated Value
Home Financials for this Owner
Home Financials are based on the most recent Mortgage that was taken out on this home.
Original Mortgage
$141,300
Outstanding Balance
$41,923
Interest Rate
7.83%
Mortgage Type
Purchase Money Mortgage
Estimated Equity
$389,177
Purchase Details
Closed on
Aug 14, 1996
Sold by
Hayward Andrew J and Hayward Lynn P
Bought by
Gannon John B and Gannon Debra L
Create a Home Valuation Report for This Property
The Home Valuation Report is an in-depth analysis detailing your home's value as well as a comparison with similar homes in the area
Home Values in the Area
Average Home Value in this Area
Purchase History
| Date | Buyer | Sale Price | Title Company |
|---|---|---|---|
| Gilmore Donna M | $157,002 | -- | |
| Gannon John B | $142,000 | -- |
Source: Public Records
Mortgage History
| Date | Status | Borrower | Loan Amount |
|---|---|---|---|
| Open | Gannon John B | $40,000 | |
| Open | Gannon John B | $141,300 |
Source: Public Records
Tax History
| Year | Tax Paid | Tax Assessment Tax Assessment Total Assessment is a certain percentage of the fair market value that is determined by local assessors to be the total taxable value of land and additions on the property. | Land | Improvement |
|---|---|---|---|---|
| 2025 | $4,797 | $316,000 | $128,700 | $187,300 |
| 2024 | $4,783 | $299,500 | $117,400 | $182,100 |
| 2023 | $4,432 | $270,700 | $111,600 | $159,100 |
| 2022 | $4,432 | $239,700 | $99,400 | $140,300 |
| 2021 | $4,291 | $227,300 | $93,800 | $133,500 |
| 2020 | $4,177 | $217,000 | $93,800 | $123,200 |
| 2019 | $4,080 | $207,400 | $89,400 | $118,000 |
| 2018 | $4,015 | $207,400 | $89,400 | $118,000 |
| 2017 | $3,954 | $203,600 | $90,700 | $112,900 |
| 2016 | $3,907 | $201,000 | $90,700 | $110,300 |
| 2015 | $3,628 | $195,700 | $90,700 | $105,000 |
| 2014 | $2,712 | $195,700 | $90,700 | $105,000 |
Source: Public Records
Map
Nearby Homes
- 0 Feeding Hills Rd
- 57 Falley Dr
- 5 Bancroft St
- 11 Laurel Terrace
- 189 Springfield Rd Unit 23
- 12 Laro Rd
- 0 E Mountain Rd
- 76 Cardinal Ln
- 1086 N Street Extension
- 999 N Street Extension
- 117 Sibley Ave
- 929 Shaker Rd Unit 18
- 242 Eastwood Dr
- 387 Southwick St
- 180 Southwick St
- 306 Feeding Hills Rd
- 65 Old Farm Rd
- 157 Cambridge St
- 1996 Westfield St
- 2 Cycle St
Your Personal Tour Guide
Ask me questions while you tour the home.