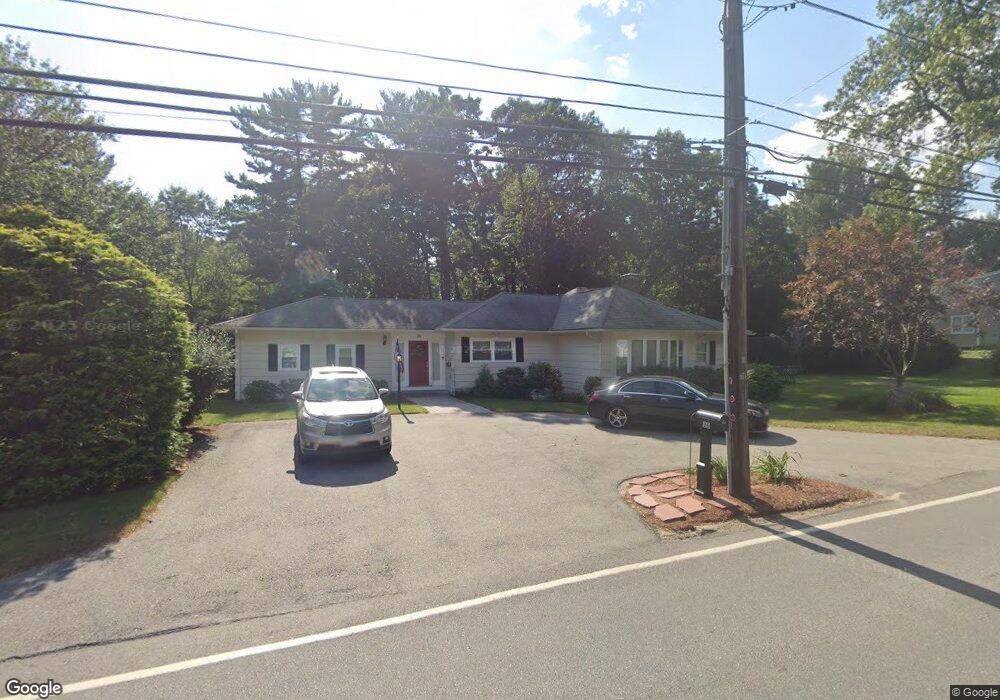
36 Chandler Rd Andover, MA 01810
West Andover NeighborhoodEstimated Value: $899,000 - $1,003,000
3
Beds
2
Baths
1,892
Sq Ft
$500/Sq Ft
Est. Value
About This Home
This home is located at 36 Chandler Rd, Andover, MA 01810 and is currently estimated at $945,404, approximately $499 per square foot. 36 Chandler Rd is a home located in Essex County with nearby schools including West Elementary School, Wood Hill Middle School, and Willow River Secondary School.
Ownership History
Date
Name
Owned For
Owner Type
Purchase Details
Closed on
Jul 21, 2008
Sold by
Ostrofsky Arnold N and Ostrofsky Sheila
Bought by
Smith Kenneth W and Smith Allyson A
Current Estimated Value
Home Financials for this Owner
Home Financials are based on the most recent Mortgage that was taken out on this home.
Original Mortgage
$386,000
Outstanding Balance
$249,210
Interest Rate
6.17%
Mortgage Type
Purchase Money Mortgage
Estimated Equity
$696,194
Purchase Details
Closed on
Jul 28, 1988
Sold by
Traub Kenneth M
Bought by
Ostrofsky Arnold N
Create a Home Valuation Report for This Property
The Home Valuation Report is an in-depth analysis detailing your home's value as well as a comparison with similar homes in the area
Home Values in the Area
Average Home Value in this Area
Purchase History
| Date | Buyer | Sale Price | Title Company |
|---|---|---|---|
| Smith Kenneth W | $429,900 | -- | |
| Smith Kenneth W | $429,900 | -- | |
| Ostrofsky Arnold N | $214,000 | -- |
Source: Public Records
Mortgage History
| Date | Status | Borrower | Loan Amount |
|---|---|---|---|
| Open | Smith Kenneth W | $386,000 | |
| Closed | Ostrofsky Arnold N | $386,000 | |
| Previous Owner | Ostrofsky Arnold N | $203,000 |
Source: Public Records
Tax History Compared to Growth
Tax History
| Year | Tax Paid | Tax Assessment Tax Assessment Total Assessment is a certain percentage of the fair market value that is determined by local assessors to be the total taxable value of land and additions on the property. | Land | Improvement |
|---|---|---|---|---|
| 2024 | $6,368 | $494,400 | $471,400 | $23,000 |
| 2023 | $9,563 | $700,100 | $424,500 | $275,600 |
| 2022 | $8,852 | $606,300 | $369,200 | $237,100 |
| 2021 | $8,458 | $553,200 | $335,700 | $217,500 |
| 2020 | $8,110 | $540,300 | $327,600 | $212,700 |
| 2019 | $8,017 | $525,000 | $317,900 | $207,100 |
| 2018 | $7,756 | $495,900 | $305,800 | $190,100 |
| 2017 | $7,409 | $488,100 | $299,700 | $188,400 |
| 2016 | $7,234 | $488,100 | $299,700 | $188,400 |
| 2015 | $6,969 | $465,500 | $288,000 | $177,500 |
Source: Public Records
Map
Nearby Homes
- 25 Clubview Dr Unit 25
- 13 Clubview Dr Unit 13
- 29 Glenwood Dr
- 0
- 96 Beacon St
- 21 Clubview Dr Unit 21
- 37 Crenshaw Ln Unit 37
- 11 Devonshire St
- 5 Marc Ln
- 42 Beresford St
- 10 Martingale Ln Unit 10
- 33 Jefferson St
- 15 Beaconsfield St
- 102 Weare St
- 54 Amherst St
- 750 Brookside Dr Unit G
- 34 Leeds Terrace
- 11 W Hawley St
- 6 Windsor St
- 38 Lincoln Cir E