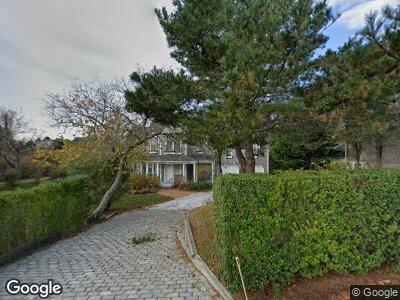
36 Derrymore Rd Nantucket, MA 02554
Estimated Value: $3,709,000 - $4,906,000
4
Beds
4
Baths
2,686
Sq Ft
$1,589/Sq Ft
Est. Value
About This Home
This home is located at 36 Derrymore Rd, Nantucket, MA 02554 and is currently estimated at $4,267,285, approximately $1,588 per square foot. 36 Derrymore Rd is a home located in Nantucket County with nearby schools including Nantucket Elementary School, Cyrus Peirce Middle School, and Nantucket High School.
Ownership History
Date
Name
Owned For
Owner Type
Purchase Details
Closed on
Feb 4, 2022
Sold by
Featherston Kathleen M
Bought by
Derrymore Road Nt and Featherston
Current Estimated Value
Purchase Details
Closed on
Nov 15, 2021
Sold by
Derrymore Road Nt and Featherston
Bought by
Featherston Kathleen M
Home Financials for this Owner
Home Financials are based on the most recent Mortgage that was taken out on this home.
Original Mortgage
$1,535,000
Interest Rate
3.01%
Mortgage Type
Stand Alone Refi Refinance Of Original Loan
Purchase Details
Closed on
Sep 5, 2002
Sold by
Tucker Edward L and Tucker Sandra A
Bought by
Carroll Francis R and Carroll Mary M
Home Financials for this Owner
Home Financials are based on the most recent Mortgage that was taken out on this home.
Original Mortgage
$800,000
Interest Rate
6.39%
Mortgage Type
Purchase Money Mortgage
Create a Home Valuation Report for This Property
The Home Valuation Report is an in-depth analysis detailing your home's value as well as a comparison with similar homes in the area
Home Values in the Area
Average Home Value in this Area
Purchase History
| Date | Buyer | Sale Price | Title Company |
|---|---|---|---|
| Derrymore Road Nt | -- | None Available | |
| Derrymore Road Nt | -- | None Available | |
| Featherston Kathleen M | -- | None Available | |
| Featherston Kathleen M | -- | None Available | |
| Carroll Francis R | $1,350,000 | -- | |
| Carroll Francis R | $1,350,000 | -- |
Source: Public Records
Mortgage History
| Date | Status | Borrower | Loan Amount |
|---|---|---|---|
| Previous Owner | Featherston Kathleen M | $1,535,000 | |
| Previous Owner | Derrymore Road Nt | $325,000 | |
| Previous Owner | Derrymore Road Nt | $334,000 | |
| Previous Owner | Derrymore Road Nt | $250,000 | |
| Previous Owner | Derrymore Road Nt | $950,000 | |
| Previous Owner | Derrymore Road Nt | $250,000 | |
| Previous Owner | Derrymore Road Nt | $2,000,000 | |
| Previous Owner | Carroll Francis R | $505,000 | |
| Previous Owner | Derrymore Road Nt | $500,000 | |
| Previous Owner | Carroll Francis R | $800,000 |
Source: Public Records
Tax History Compared to Growth
Tax History
| Year | Tax Paid | Tax Assessment Tax Assessment Total Assessment is a certain percentage of the fair market value that is determined by local assessors to be the total taxable value of land and additions on the property. | Land | Improvement |
|---|---|---|---|---|
| 2025 | $11,253 | $3,430,800 | $1,578,000 | $1,852,800 |
| 2024 | $10,559 | $3,373,400 | $1,578,000 | $1,795,400 |
| 2023 | $9,351 | $2,913,000 | $1,504,800 | $1,408,200 |
| 2022 | $91 | $2,440,000 | $1,261,600 | $1,178,400 |
| 2021 | $8,391 | $2,311,700 | $1,162,000 | $1,149,700 |
| 2020 | $7,975 | $2,311,700 | $1,162,000 | $1,149,700 |
| 2019 | $7,697 | $2,290,700 | $1,141,000 | $1,149,700 |
| 2018 | $6,364 | $2,003,500 | $1,141,000 | $862,500 |
| 2017 | $6,792 | $2,003,500 | $1,141,000 | $862,500 |
| 2016 | $5,025 | $1,495,500 | $652,000 | $843,500 |
| 2015 | $4,871 | $1,349,300 | $564,000 | $785,300 |
| 2014 | $5,073 | $1,349,300 | $564,000 | $785,300 |
Source: Public Records
Map
Nearby Homes
- 78 Cliff Rd
- 8 Derry Ln
- 84 Cliff Rd
- 19 Sherburne Turnpike
- 15 Delaney Rd
- 13 Derrymore Rd
- 7 Shady Ln
- 60 Cliff Rd
- 6 & 8 Sherburne Turnpike
- 6 Gingy Ln
- 47 W Chester St
- 49A W Chester St
- 51 N Liberty St
- 4 Sunset Hill Ln
- 35 W Chester St
- 5 Stone Barn Way Unit D
- 1 E Hallowell Ln
- 23 B W Chester St
- 27 N Liberty St
- 11 Meadow Ln