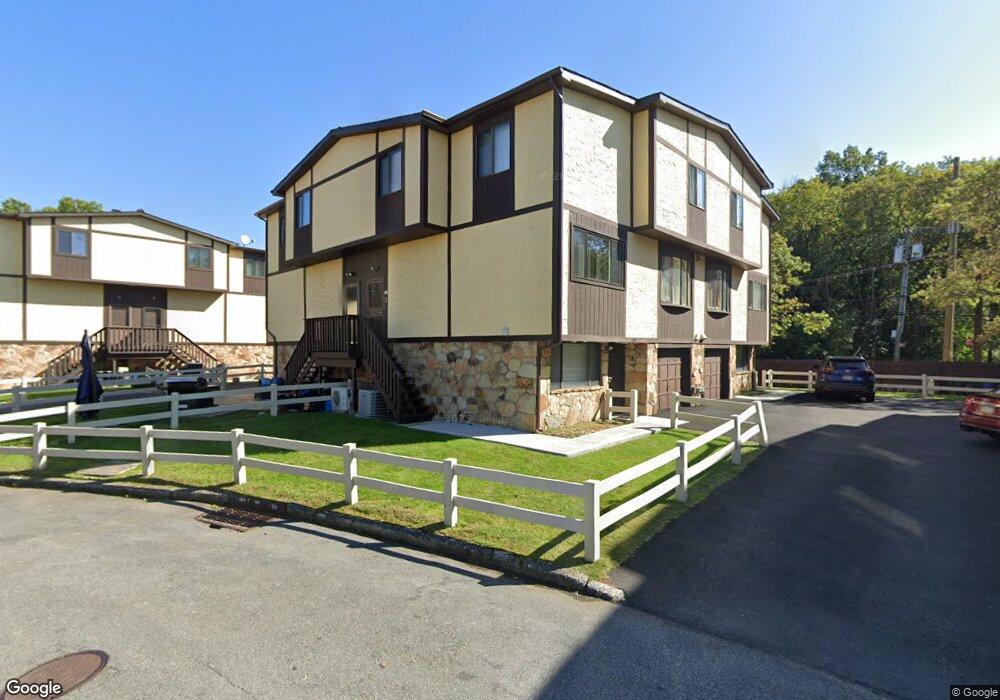
36 Parkview Loop Unit 13 Staten Island, NY 10314
Willowbrook NeighborhoodEstimated Value: $536,000 - $575,664
3
Beds
3
Baths
1,480
Sq Ft
$381/Sq Ft
Est. Value
About This Home
This home is located at 36 Parkview Loop Unit 13, Staten Island, NY 10314 and is currently estimated at $563,166, approximately $380 per square foot. 36 Parkview Loop Unit 13 is a home located in Richmond County with nearby schools including P.S. 060 Alice Austen School, Is 72 Rocco Laurie, and Port Richmond High School.
Ownership History
Date
Name
Owned For
Owner Type
Purchase Details
Closed on
Sep 18, 2021
Sold by
Kwan Tse Siu
Bought by
Tse Sandy and Tse Connie
Current Estimated Value
Purchase Details
Closed on
Feb 24, 2010
Sold by
Tse Siu Kwan and Tse Choi Wan
Bought by
Tse Siu Kwan and Tse Choi Wan
Purchase Details
Closed on
Jul 14, 2005
Sold by
Kwak Ho Nam and Kwak Myung Sook
Bought by
Tse Choi Wan and Tse Siu Kwan
Home Financials for this Owner
Home Financials are based on the most recent Mortgage that was taken out on this home.
Original Mortgage
$250,000
Interest Rate
5.92%
Mortgage Type
Fannie Mae Freddie Mac
Purchase Details
Closed on
Feb 8, 2000
Sold by
Do Ae Jo and Do Chang Hwan
Bought by
Kwak Ho Nam and Kwak Myung Sook
Home Financials for this Owner
Home Financials are based on the most recent Mortgage that was taken out on this home.
Original Mortgage
$125,000
Interest Rate
8.21%
Purchase Details
Closed on
Apr 25, 1996
Sold by
Hu Lai Si Ming and Hu Lai Jenny
Bought by
Do Ae Ja and Do Chang Hwan
Create a Home Valuation Report for This Property
The Home Valuation Report is an in-depth analysis detailing your home's value as well as a comparison with similar homes in the area
Home Values in the Area
Average Home Value in this Area
Purchase History
| Date | Buyer | Sale Price | Title Company |
|---|---|---|---|
| Tse Sandy | -- | None Listed On Document | |
| Tse Siu Kwan | -- | The Judicial Title Insurance | |
| Tse Choi Wan | $335,000 | Fidelity National Title Insu | |
| Kwak Ho Nam | $157,000 | -- | |
| Do Ae Ja | $104,000 | -- |
Source: Public Records
Mortgage History
| Date | Status | Borrower | Loan Amount |
|---|---|---|---|
| Previous Owner | Tse Choi Wan | $250,000 | |
| Previous Owner | Kwak Ho Nam | $125,000 |
Source: Public Records
Tax History
| Year | Tax Paid | Tax Assessment Tax Assessment Total Assessment is a certain percentage of the fair market value that is determined by local assessors to be the total taxable value of land and additions on the property. | Land | Improvement |
|---|---|---|---|---|
| 2025 | $4,586 | $34,327 | $1,753 | $32,574 |
| 2024 | $4,598 | $28,927 | $2,064 | $26,863 |
| 2023 | $4,359 | $22,862 | $1,940 | $20,922 |
| 2022 | $4,019 | $25,806 | $2,464 | $23,342 |
| 2021 | $3,980 | $23,435 | $2,464 | $20,971 |
| 2020 | $4,011 | $23,269 | $2,464 | $20,805 |
| 2019 | $3,931 | $21,834 | $2,464 | $19,370 |
| 2018 | $3,586 | $19,052 | $2,193 | $16,859 |
| 2017 | $3,364 | $17,974 | $2,249 | $15,725 |
| 2016 | $3,080 | $16,958 | $2,166 | $14,792 |
| 2015 | $2,924 | $16,958 | $2,030 | $14,928 |
| 2014 | $2,924 | $16,828 | $2,315 | $14,513 |
Source: Public Records
Map
Nearby Homes
- 60 Parkview Loop
- 15 Parkview Loop
- 14 Parkview Loop
- 100 Debbie St Unit B
- 44 Debbie St Unit B
- 41 Jennifer Place Unit B
- 59 Jennifer Place Unit a
- 24 Merrill Ave
- 537 Willow Rd E Unit 1
- 238 Cambridge Ave
- 234 Cambridge Ave
- 251 Cambridge Ave
- 226 Cambridge Ave
- 71 Goller Place
- 37 Dreyer Ave Unit A
- 1406 Richmond Ave
- 87 Saybrook St
- 74 Sumner Ave
- 205 Hawthorne Ave
- 448-2 Caswell Ave
- 38 Parkview Loop
- 34 Parkview Loop
- 28 Parkview Loop Unit 12
- 30 Parkview Loop Unit 11
- 46 Parkview Loop Unit 18
- 48 Parkview Loop Unit 17
- 26 Parkview Loop
- 24 Parkview Loop Unit 10
- 44 Parkview Loop Unit 19
- 23 Parkview Loop
- 50 Parkview Loop
- 25 Parkview Loop Unit 37
- 21 Parkview Loop
- 56 Parkview Loop Unit 21
- 27 Parkview Loop Unit 39
- 22 Parkview Loop Unit 7
- 54 Parkview Loop
- 55 Parkview Loop
- 20 Parkview Loop Unit 8
- 58 Parkview Loop
Your Personal Tour Guide
Ask me questions while you tour the home.