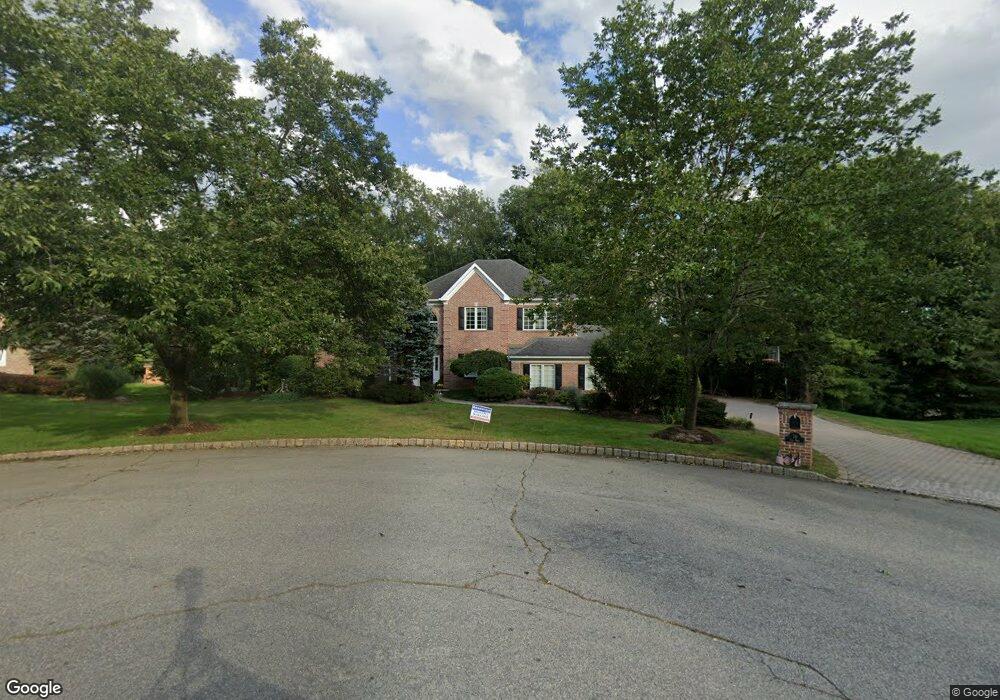
36 Pine Rd Allendale, NJ 07401
Estimated Value: $1,671,000 - $1,802,000
Studio
--
Bath
3,656
Sq Ft
$474/Sq Ft
Est. Value
About This Home
This home is located at 36 Pine Rd, Allendale, NJ 07401 and is currently estimated at $1,733,269, approximately $474 per square foot. 36 Pine Rd is a home located in Bergen County with nearby schools including Hillside Elementary School, Brookside Elementary School, and Northern Highlands Reg High School.
Ownership History
Date
Name
Owned For
Owner Type
Purchase Details
Closed on
Nov 1, 2006
Sold by
Eydenberg John
Bought by
Eydenberg Melissa
Current Estimated Value
Purchase Details
Closed on
Dec 9, 1994
Sold by
Allendale Dev Inc
Bought by
Grefe David and Grefe Lisa
Home Financials for this Owner
Home Financials are based on the most recent Mortgage that was taken out on this home.
Original Mortgage
$500,000
Interest Rate
9.03%
Create a Home Valuation Report for This Property
The Home Valuation Report is an in-depth analysis detailing your home's value as well as a comparison with similar homes in the area
Home Values in the Area
Average Home Value in this Area
Purchase History
| Date | Buyer | Sale Price | Title Company |
|---|---|---|---|
| Eydenberg Melissa | -- | -- | |
| Grefe David | $584,990 | -- |
Source: Public Records
Mortgage History
| Date | Status | Borrower | Loan Amount |
|---|---|---|---|
| Previous Owner | Grefe David | $500,000 |
Source: Public Records
Tax History
| Year | Tax Paid | Tax Assessment Tax Assessment Total Assessment is a certain percentage of the fair market value that is determined by local assessors to be the total taxable value of land and additions on the property. | Land | Improvement |
|---|---|---|---|---|
| 2025 | $28,566 | $1,462,500 | $649,000 | $813,500 |
| 2024 | $27,197 | $1,354,500 | $624,000 | $730,500 |
| 2023 | $26,737 | $1,236,800 | $523,500 | $713,300 |
| 2022 | $26,737 | $1,174,200 | $493,500 | $680,700 |
| 2021 | $26,168 | $1,114,000 | $450,500 | $663,500 |
| 2020 | $26,442 | $1,095,800 | $443,000 | $652,800 |
| 2019 | $25,740 | $1,095,800 | $443,000 | $652,800 |
| 2018 | $25,171 | $1,095,800 | $443,000 | $652,800 |
| 2017 | $25,072 | $1,095,800 | $443,000 | $652,800 |
| 2016 | $25,105 | $1,095,800 | $443,000 | $652,800 |
| 2015 | $24,601 | $1,095,800 | $443,000 | $652,800 |
| 2014 | $25,122 | $1,049,000 | $443,000 | $606,000 |
Source: Public Records
Map
Nearby Homes
- 19 Fox Run Rd Unit 19
- 75 Cherokee Ave
- 33 Sherwood Dr
- 6 Cottage Place
- 19 Crescent Hollow Ct
- 29 Wildwood Rd
- 8 Crestwood Mews
- 77 Myrtle Ave
- 10 E Allendale Rd
- 373 W Crescent Ave
- 260 W Allendale Ave
- 7 Brookside Dr
- 48 Pleasant Ave
- 32 Brookside Dr
- 5 Burning Hollow Rd
- 64 Stoney Ridge Rd
- 10 Big Ramapo Rd
- 33 Homewood Ave
- 122 Orchard Place
- 6 Burning Hollow Rd
Your Personal Tour Guide
Ask me questions while you tour the home.