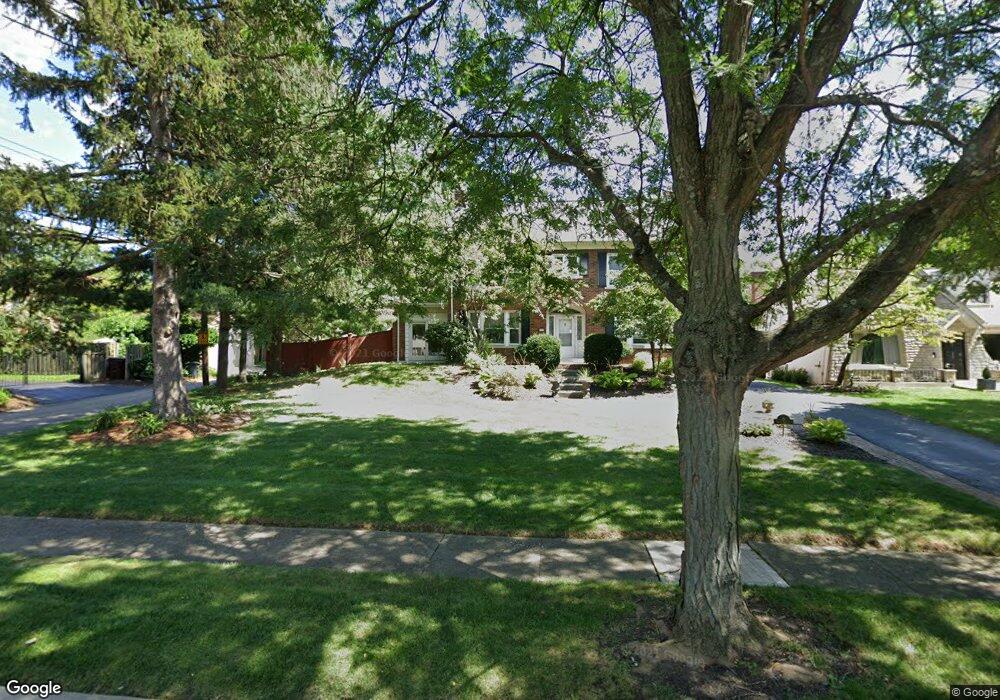
36 S Ardmore Rd Columbus, OH 43209
Estimated Value: $615,000 - $915,939
5
Beds
3
Baths
3,239
Sq Ft
$253/Sq Ft
Est. Value
About This Home
This home is located at 36 S Ardmore Rd, Columbus, OH 43209 and is currently estimated at $819,235, approximately $252 per square foot. 36 S Ardmore Rd is a home located in Franklin County with nearby schools including Cassingham Elementary School, Bexley Middle School, and Bexley High School.
Ownership History
Date
Name
Owned For
Owner Type
Purchase Details
Closed on
Nov 23, 2023
Sold by
Greenberg Joshua W and Greenberg Amy
Bought by
36 South Ardmore Road Llc
Current Estimated Value
Purchase Details
Closed on
Aug 18, 2017
Sold by
Schildhouse Ruth S
Bought by
Greenberg Joshua W
Purchase Details
Closed on
Dec 5, 1994
Sold by
Jarvis Michael J
Bought by
Joshua W Greenberg and Joshua Amy Schlindhouse
Home Financials for this Owner
Home Financials are based on the most recent Mortgage that was taken out on this home.
Original Mortgage
$220,000
Interest Rate
7.5%
Mortgage Type
New Conventional
Purchase Details
Closed on
Jul 1, 1987
Create a Home Valuation Report for This Property
The Home Valuation Report is an in-depth analysis detailing your home's value as well as a comparison with similar homes in the area
Home Values in the Area
Average Home Value in this Area
Purchase History
| Date | Buyer | Sale Price | Title Company |
|---|---|---|---|
| 36 South Ardmore Road Llc | -- | None Listed On Document | |
| Greenberg Joshua W | $308,600 | None Available | |
| Joshua W Greenberg | $250,000 | -- | |
| -- | $173,500 | -- |
Source: Public Records
Mortgage History
| Date | Status | Borrower | Loan Amount |
|---|---|---|---|
| Previous Owner | Joshua W Greenberg | $220,000 |
Source: Public Records
Tax History Compared to Growth
Tax History
| Year | Tax Paid | Tax Assessment Tax Assessment Total Assessment is a certain percentage of the fair market value that is determined by local assessors to be the total taxable value of land and additions on the property. | Land | Improvement |
|---|---|---|---|---|
| 2024 | $13,106 | $236,010 | $66,190 | $169,820 |
| 2023 | $11,784 | $236,010 | $66,190 | $169,820 |
| 2022 | $13,538 | $217,770 | $58,030 | $159,740 |
| 2021 | $13,549 | $217,770 | $58,030 | $159,740 |
| 2020 | $13,430 | $217,770 | $58,030 | $159,740 |
| 2019 | $12,711 | $181,340 | $48,370 | $132,970 |
| 2018 | $10,854 | $181,340 | $48,370 | $132,970 |
| 2017 | $10,705 | $181,340 | $48,370 | $132,970 |
| 2016 | $10,632 | $163,460 | $47,290 | $116,170 |
| 2015 | $10,664 | $163,460 | $47,290 | $116,170 |
| 2014 | $10,724 | $163,460 | $47,290 | $116,170 |
| 2013 | $5,067 | $148,575 | $42,980 | $105,595 |
Source: Public Records
Map
Nearby Homes
- 2629 E Broad St
- 2717 E Broad St
- 49 N Cassingham Rd
- 2731 E Broad St
- 2738 E Broad St
- 208 S Stanwood Rd
- 96 N Cassingham Rd
- 268 S Cassady Ave
- 2455 Dale Ave
- 123 S Gould Rd
- 142 S Gould Rd
- 50 N Broadleigh Rd
- 50 S Chesterfield Rd
- 291 N Drexel Ave
- 47 N Chesterfield Rd
- 189 N Parkview Ave
- 205 N Gould Rd
- 57 Preston Rd
- 2425 Bryden Rd
- 2867 Ruhl Ave Unit 869
- 44 S Ardmore Rd
- 50 S Ardmore Rd
- 43 S Cassingham Rd
- 2601 E Broad St
- 2607 E Broad St
- 35 S Cassingham Rd
- 56 S Ardmore Rd
- 51 S Cassingham Rd
- 2619 E Broad St
- 57 S Cassingham Rd
- 33 S Ardmore Rd
- 62 S Ardmore Rd
- 2585 E Broad St
- 63 S Cassingham Rd
- 39 S Ardmore Rd
- 47 S Ardmore Rd
- 69 S Cassingham Rd
- 70 S Ardmore Rd
- 53 S Ardmore Rd
- 2635 E Broad St