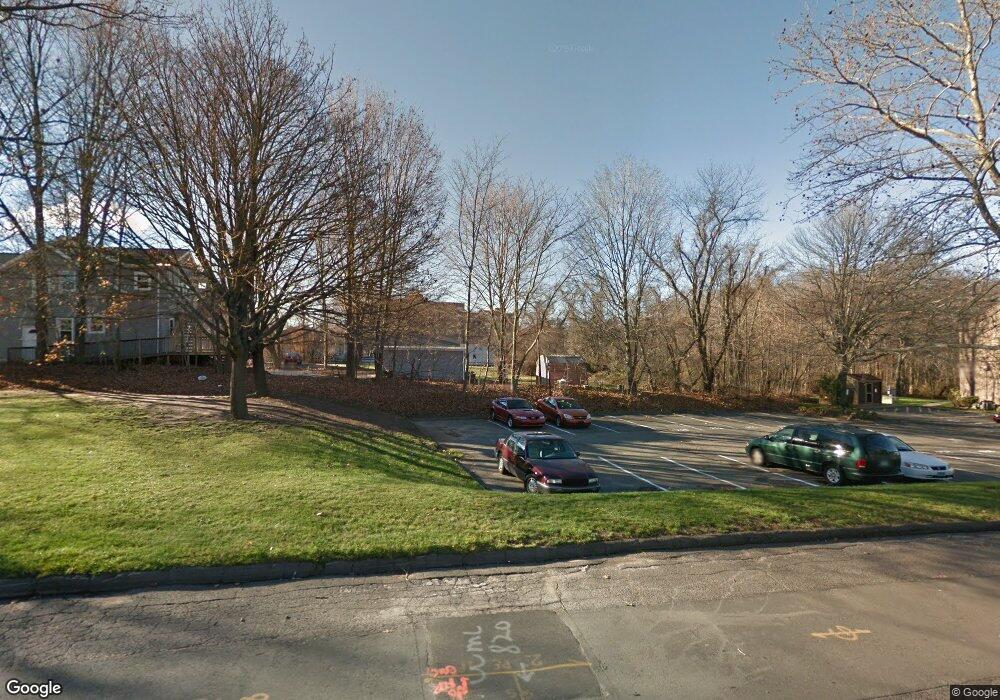
36 Towne House Rd Hamden, CT 06514
Estimated Value: $205,000 - $214,941
2
Beds
2
Baths
953
Sq Ft
$222/Sq Ft
Est. Value
About This Home
This home is located at 36 Towne House Rd, Hamden, CT 06514 and is currently estimated at $211,485, approximately $221 per square foot. 36 Towne House Rd is a home located in New Haven County with nearby schools including Hamden Middle School, Hamden High School, and Alphabet Academy - Hamden North Campus.
Ownership History
Date
Name
Owned For
Owner Type
Purchase Details
Closed on
Jun 23, 2011
Sold by
Garibaldi Joseph
Bought by
Leith-Lobban Coralee O
Current Estimated Value
Home Financials for this Owner
Home Financials are based on the most recent Mortgage that was taken out on this home.
Original Mortgage
$130,290
Outstanding Balance
$89,269
Interest Rate
4.5%
Mortgage Type
FHA
Estimated Equity
$122,216
Purchase Details
Closed on
Dec 11, 2003
Sold by
Lyon Robert W and Lyon Diane B
Bought by
Garibaldi Joseph
Home Financials for this Owner
Home Financials are based on the most recent Mortgage that was taken out on this home.
Original Mortgage
$118,300
Interest Rate
5.9%
Purchase Details
Closed on
Nov 30, 2001
Sold by
Ranchinsky William R and Ranchinsky Mary F
Bought by
Lyon Robert W and Lyon Diane B
Home Financials for this Owner
Home Financials are based on the most recent Mortgage that was taken out on this home.
Original Mortgage
$104,760
Interest Rate
6.66%
Create a Home Valuation Report for This Property
The Home Valuation Report is an in-depth analysis detailing your home's value as well as a comparison with similar homes in the area
Home Values in the Area
Average Home Value in this Area
Purchase History
| Date | Buyer | Sale Price | Title Company |
|---|---|---|---|
| Leith-Lobban Coralee O | $135,000 | -- | |
| Garibaldi Joseph | $138,000 | -- | |
| Lyon Robert W | $108,000 | -- |
Source: Public Records
Mortgage History
| Date | Status | Borrower | Loan Amount |
|---|---|---|---|
| Open | Lyon Robert W | $130,290 | |
| Previous Owner | Lyon Robert W | $118,300 | |
| Previous Owner | Lyon Robert W | $104,760 |
Source: Public Records
Tax History Compared to Growth
Tax History
| Year | Tax Paid | Tax Assessment Tax Assessment Total Assessment is a certain percentage of the fair market value that is determined by local assessors to be the total taxable value of land and additions on the property. | Land | Improvement |
|---|---|---|---|---|
| 2024 | $4,375 | $78,680 | $0 | $78,680 |
| 2023 | $4,436 | $78,680 | $0 | $78,680 |
| 2022 | $4,365 | $78,680 | $0 | $78,680 |
| 2021 | $4,126 | $78,680 | $0 | $78,680 |
| 2020 | $3,868 | $74,410 | $0 | $74,410 |
| 2019 | $3,636 | $74,410 | $0 | $74,410 |
| 2018 | $3,569 | $74,410 | $0 | $74,410 |
| 2017 | $3,368 | $74,410 | $0 | $74,410 |
| 2016 | $3,375 | $74,410 | $0 | $74,410 |
| 2015 | $3,756 | $91,910 | $0 | $91,910 |
| 2014 | $3,670 | $91,910 | $0 | $91,910 |
Source: Public Records
Map
Nearby Homes
- 116 Towne House Rd
- 181 Towne House Rd Unit 181
- 204 Towne House Rd
- 131 E Gate Ln
- 707 Mix Ave Unit 34
- 900 Mix Ave Unit 36
- 900 Mix Ave Unit 109
- 900 Mix Ave Unit 10
- 900 Mix Ave Unit 23
- 92 Shepards Knoll Dr Unit 92
- 136 Shepard Ave Unit 136
- 371 Denslow Hill Rd
- 69 Rentell Rd
- 115 Earl Ave
- 90 Brook Hill Rd
- 279 Centerbrook Rd
- 72 Hobson Ave
- 237 Centerbrook Rd
- 240 Centerbrook Rd Unit 240
- 219 Centerbrook Rd
- 38 Towne House Rd
- 38 Towne House Rd Unit 38
- 36 Towne House Rd Unit 36
- 40 Towne House Rd
- 40 Towne House Rd Unit 40
- 34 Towne House Rd
- 42 Towne House Rd
- 32 Towne House Rd
- 32 Towne House Rd Unit 32
- 44 Towne House Rd
- 46 Towne House Rd
- 46 Towne House Rd Unit 46
- 30 Towne House Rd
- 28 Towne House Rd
- 48 Towne House Rd
- 48 Towne House Rd Unit 48
- 50 Towne House Rd
- 50 Towne House Rd Unit 50
- 26 Towne House Rd
- 26 Towne House Rd Unit 26