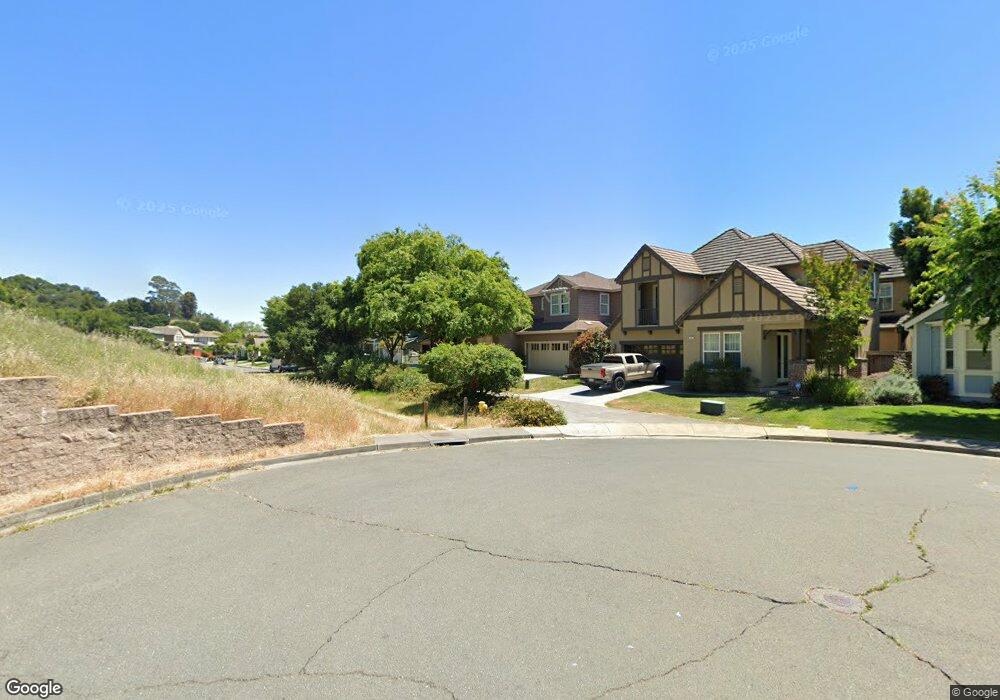
36 White Oak Way Novato, CA 94949
Ignacio NeighborhoodEstimated Value: $1,626,000 - $1,732,000
4
Beds
4
Baths
2,740
Sq Ft
$611/Sq Ft
Est. Value
About This Home
This home is located at 36 White Oak Way, Novato, CA 94949 and is currently estimated at $1,675,392, approximately $611 per square foot. 36 White Oak Way is a home located in Marin County with nearby schools including Loma Verde Elementary School, Novato High School, and Novato Charter School.
Ownership History
Date
Name
Owned For
Owner Type
Purchase Details
Closed on
Nov 12, 2007
Sold by
Eklund Patricia D
Bought by
Eklund Patricia D
Current Estimated Value
Purchase Details
Closed on
Dec 14, 2002
Sold by
Shea Homes Ltd Partnership
Bought by
Eklund Patricia D
Home Financials for this Owner
Home Financials are based on the most recent Mortgage that was taken out on this home.
Original Mortgage
$616,700
Outstanding Balance
$241,175
Interest Rate
5%
Estimated Equity
$1,434,217
Purchase Details
Closed on
Nov 19, 2002
Sold by
Novato Community Partners Llc
Bought by
Shea Homes Ltd Partnership
Home Financials for this Owner
Home Financials are based on the most recent Mortgage that was taken out on this home.
Original Mortgage
$616,700
Outstanding Balance
$241,175
Interest Rate
5%
Estimated Equity
$1,434,217
Purchase Details
Closed on
Jun 13, 2002
Sold by
Novato Community Partners Llc
Bought by
Shea Homes Ltd Partnership
Create a Home Valuation Report for This Property
The Home Valuation Report is an in-depth analysis detailing your home's value as well as a comparison with similar homes in the area
Home Values in the Area
Average Home Value in this Area
Purchase History
| Date | Buyer | Sale Price | Title Company |
|---|---|---|---|
| Eklund Patricia D | -- | None Available | |
| Eklund Patricia D | $771,000 | -- | |
| Shea Homes Ltd Partnership | -- | -- | |
| Shea Homes Ltd Partnership | -- | -- |
Source: Public Records
Mortgage History
| Date | Status | Borrower | Loan Amount |
|---|---|---|---|
| Open | Eklund Patricia D | $616,700 |
Source: Public Records
Tax History Compared to Growth
Tax History
| Year | Tax Paid | Tax Assessment Tax Assessment Total Assessment is a certain percentage of the fair market value that is determined by local assessors to be the total taxable value of land and additions on the property. | Land | Improvement |
|---|---|---|---|---|
| 2025 | $15,894 | $1,116,494 | $416,290 | $700,204 |
| 2024 | $15,894 | $1,094,608 | $408,130 | $686,478 |
| 2023 | $15,887 | $1,073,152 | $400,130 | $673,022 |
| 2022 | $15,543 | $1,052,112 | $392,285 | $659,827 |
| 2021 | $15,508 | $1,031,489 | $384,596 | $646,893 |
| 2020 | $15,283 | $1,020,920 | $380,655 | $640,265 |
| 2019 | $15,058 | $1,000,905 | $373,192 | $627,713 |
| 2018 | $14,867 | $981,285 | $365,877 | $615,408 |
| 2017 | $14,636 | $962,050 | $358,705 | $603,345 |
| 2016 | $13,733 | $943,192 | $351,674 | $591,518 |
| 2015 | $13,520 | $899,451 | $434,218 | $465,233 |
| 2014 | $12,465 | $803,082 | $387,695 | $415,387 |
Source: Public Records
Map
Nearby Homes
- 71 Oak Grove Dr
- 8 Oak Grove Dr Unit 201
- 432 Calle de la Mesa
- 456 Alameda de la Loma
- 510 Entrada Dr Unit 203
- 201 Deborah Ct
- 120 Fairway Dr
- 10 Pebble Beach Dr
- 844 Arlene Way
- 45 Wimbledon Ct
- 130 Fairway Dr
- 64 Los Padres Cir
- 121 Cheda Ln
- 615 Calle Arboleda
- 38 Plumas Cir Unit 2
- 487 Alameda Del Prado
- 323 Silvio Ln Unit 4
- 306 Silvio Ln Unit 204
- 1256 Highland Dr
- 1 Columbine Ln
- 32 White Oak Way
- 31 Elmview Way
- 28 White Oak Way
- 70 Hollyleaf Way
- 74 Hollyleaf Way
- 31 Tan Oak Way
- 66 Hollyleaf Way
- 27 Tan Oak Way
- 24 White Oak Way
- 23 Elmview Way
- 23 Tan Oak Way
- 62 Hollyleaf Way
- 20 White Oak Way
- 19 Elmview Way
- 19 White Oak Way
- 93 Hollyleaf Way
- 58 Hollyleaf Way
- 19 Tan Oak Way
- 28 Tan Oak Way
- 89 Hollyleaf Way