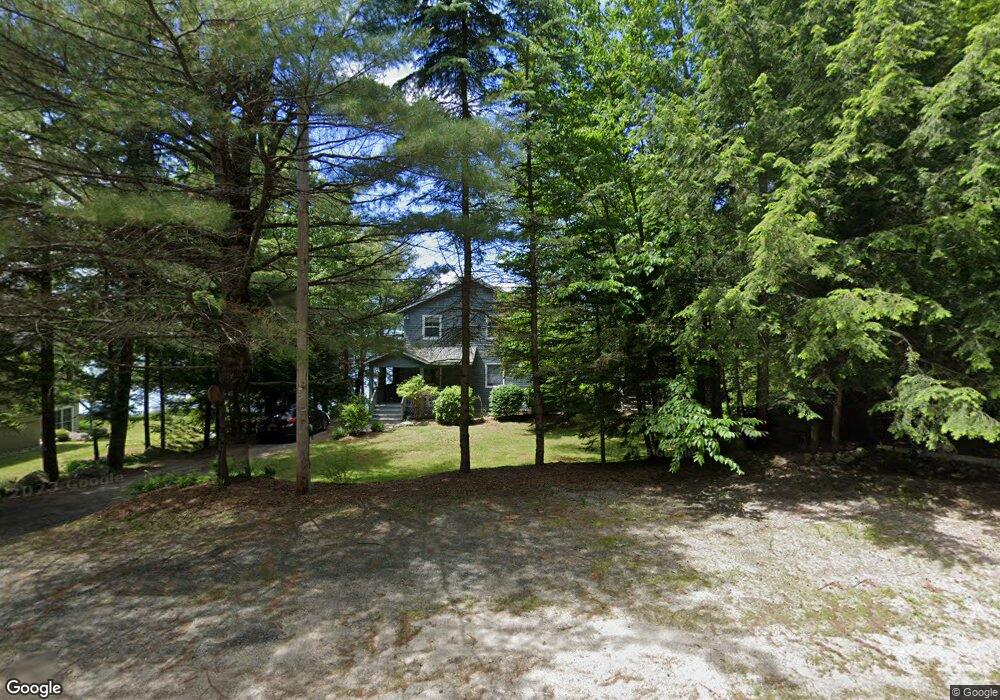
360 Bowles Rd Newbury, NH 03255
Estimated Value: $1,432,000 - $2,473,000
--
Bed
2
Baths
2,645
Sq Ft
$740/Sq Ft
Est. Value
About This Home
This home is located at 360 Bowles Rd, Newbury, NH 03255 and is currently estimated at $1,958,459, approximately $740 per square foot. 360 Bowles Rd is a home with nearby schools including Kearsarge Regional Elementary School at Bradford, Kearsarge Regional Middle School, and Kearsarge Regional High School.
Ownership History
Date
Name
Owned For
Owner Type
Purchase Details
Closed on
Aug 17, 2010
Sold by
Brena Jose G and Brena Margaret E Grac
Bought by
Stevens Timothy P and Steven Catherine F Gra
Current Estimated Value
Home Financials for this Owner
Home Financials are based on the most recent Mortgage that was taken out on this home.
Original Mortgage
$764,850
Interest Rate
4.63%
Mortgage Type
Purchase Money Mortgage
Create a Home Valuation Report for This Property
The Home Valuation Report is an in-depth analysis detailing your home's value as well as a comparison with similar homes in the area
Home Values in the Area
Average Home Value in this Area
Purchase History
| Date | Buyer | Sale Price | Title Company |
|---|---|---|---|
| Stevens Timothy P | $750,000 | -- |
Source: Public Records
Mortgage History
| Date | Status | Borrower | Loan Amount |
|---|---|---|---|
| Open | Stevens Timothy P | $701,250 | |
| Closed | Stevens Timothy P | $764,850 |
Source: Public Records
Tax History Compared to Growth
Tax History
| Year | Tax Paid | Tax Assessment Tax Assessment Total Assessment is a certain percentage of the fair market value that is determined by local assessors to be the total taxable value of land and additions on the property. | Land | Improvement |
|---|---|---|---|---|
| 2024 | $19,475 | $1,492,300 | $1,207,000 | $285,300 |
| 2023 | $19,475 | $1,492,300 | $1,207,000 | $285,300 |
| 2022 | $16,982 | $1,492,300 | $1,207,000 | $285,300 |
| 2021 | $16,982 | $1,492,300 | $1,207,000 | $285,300 |
| 2020 | $15,666 | $948,300 | $759,900 | $188,400 |
| 2019 | $15,059 | $948,300 | $759,900 | $188,400 |
| 2018 | $14,699 | $948,300 | $759,900 | $188,400 |
| 2017 | $14,898 | $948,300 | $759,900 | $188,400 |
| 2016 | $15,220 | $948,300 | $759,900 | $188,400 |
| 2015 | $16,692 | $1,025,300 | $793,400 | $231,900 |
| 2014 | $15,882 | $1,025,300 | $793,400 | $231,900 |
| 2013 | $15,308 | $1,025,300 | $793,400 | $231,900 |
Source: Public Records
Map
Nearby Homes
- 37 Baker Hill Rd
- 91 Chalk Pond Rd
- 12 Shadow Ln
- 30 Greystone Ln
- Lower Crest Rd
- 253 Lake Ave
- 25 Hilltop Dr
- 8 Snow Rd
- 81 Gerald Dr
- 0 Edgemont Rd Unit 44
- 315 Edgemont Rd
- 33 Chandler Brook Rd
- 344 Chalk Pond Rd
- 20 Edgemont Landing Rd
- 274 Edgemont Rd
- 14 Lake Ave Unit 1
- 81 Lakewood Manor Rd
- 1386 Route 103
- 55 High St
- 0 Lakewood Manor Rd Unit 467