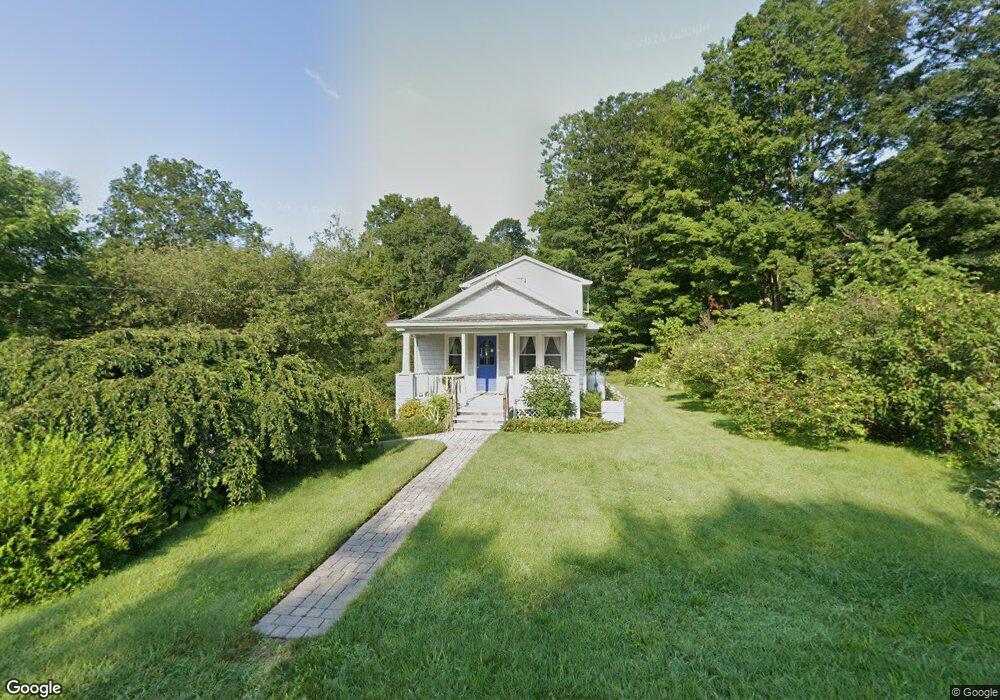
360 N Farms Rd Unit 1 Florence, MA 01062
Estimated Value: $494,847 - $511,000
2
Beds
3
Baths
1,196
Sq Ft
$420/Sq Ft
Est. Value
About This Home
This home is located at 360 N Farms Rd Unit 1, Florence, MA 01062 and is currently estimated at $502,212, approximately $419 per square foot. 360 N Farms Rd Unit 1 is a home located in Hampshire County with nearby schools including Northampton High School, The Montessori School of Northampton, and Lander Grinspoon Academy.
Ownership History
Date
Name
Owned For
Owner Type
Purchase Details
Closed on
Aug 1, 2016
Sold by
Gordon Albert R Est
Bought by
Fiveash Katherine
Current Estimated Value
Purchase Details
Closed on
Apr 14, 2014
Sold by
Fiveash Katherine
Bought by
Fiveash Polly and Fiveash Matthew
Purchase Details
Closed on
Dec 12, 2007
Sold by
Gordon Albert R and Fiveash Katherine
Bought by
Gordon Albert R and Fiveash Katherine
Purchase Details
Closed on
Oct 17, 2006
Sold by
Jones Douglas R and Jones Susan E
Bought by
Gordon Albert R and Fiveash Katherine
Purchase Details
Closed on
Jan 19, 2005
Sold by
Jones Susan E and Jones Douglas R
Bought by
Jones Douglas R and Jones Susan E
Purchase Details
Closed on
Jun 17, 1998
Sold by
Eddy Cynthia
Bought by
Eddy Susan
Home Financials for this Owner
Home Financials are based on the most recent Mortgage that was taken out on this home.
Original Mortgage
$87,000
Interest Rate
7.09%
Mortgage Type
Purchase Money Mortgage
Create a Home Valuation Report for This Property
The Home Valuation Report is an in-depth analysis detailing your home's value as well as a comparison with similar homes in the area
Home Values in the Area
Average Home Value in this Area
Purchase History
| Date | Buyer | Sale Price | Title Company |
|---|---|---|---|
| Fiveash Katherine | -- | -- | |
| Fiveash Polly | -- | -- | |
| Gordon Albert R | $306,000 | -- | |
| Gordon Albert R | $306,000 | -- | |
| Jones Douglas R | -- | -- | |
| Eddy Susan | $85,100 | -- |
Source: Public Records
Mortgage History
| Date | Status | Borrower | Loan Amount |
|---|---|---|---|
| Previous Owner | Eddy Susan | $120,000 | |
| Previous Owner | Eddy Susan | $84,000 | |
| Previous Owner | Eddy Susan | $87,000 |
Source: Public Records
Tax History Compared to Growth
Tax History
| Year | Tax Paid | Tax Assessment Tax Assessment Total Assessment is a certain percentage of the fair market value that is determined by local assessors to be the total taxable value of land and additions on the property. | Land | Improvement |
|---|---|---|---|---|
| 2025 | $5,681 | $407,800 | $88,200 | $319,600 |
| 2024 | $5,402 | $355,600 | $84,000 | $271,600 |
| 2023 | $5,332 | $336,600 | $76,300 | $260,300 |
| 2022 | $5,058 | $282,700 | $71,300 | $211,400 |
| 2021 | $4,370 | $251,600 | $67,900 | $183,700 |
| 2020 | $4,227 | $251,600 | $67,900 | $183,700 |
| 2019 | $4,266 | $245,600 | $80,400 | $165,200 |
| 2018 | $4,129 | $242,300 | $80,400 | $161,900 |
| 2017 | $4,044 | $242,300 | $80,400 | $161,900 |
| 2016 | $3,916 | $242,300 | $80,400 | $161,900 |
| 2015 | $3,923 | $248,300 | $85,400 | $162,900 |
| 2014 | $3,821 | $248,300 | $85,400 | $162,900 |
Source: Public Records
Map
Nearby Homes
- 213 Spring Grove Ave
- 339 Haydenville Rd
- 0 Haydenville Rd
- 20 Bridge Rd Unit 8
- 48 Evergreen Rd Unit 306
- 201 Main St
- 140 Florence St
- 44 Evergreen Rd Unit 302
- 37 N Farms Rd
- 90 Fox Farms Rd
- 0 Old Stage Rd Unit 73394977
- 15 Cole Rd
- 32 Stonewall Dr
- 93 Laurel Park Unit 93
- 222 River Rd
- 66 Laurel Park Unit 66
- 84 N Main St
- 43 Laurel Park Unit 43
- 89 Main St Unit D
- 76 Maple St
- 360 N Farms Rd
- 360 N Farms Rd Unit .
- 372 N Farms Rd
- 367 N Farms Rd
- 357 N Farms Rd
- 373 N Farms Rd
- 332 N Farms Rd
- 332 N Farms Rd Unit 1
- 384 N Farms Rd
- 326 N Farms Rd
- 331 N Farms Rd
- 381 N Farms Rd
- 390 N Farms Rd
- 327 N Farms Rd
- 406 N Farms Rd
- 320 N Farms Rd
- 400 N Farms Rd
- 397 N Farms Rd
- 408 N Farms Rd
- 395 N Farms Rd