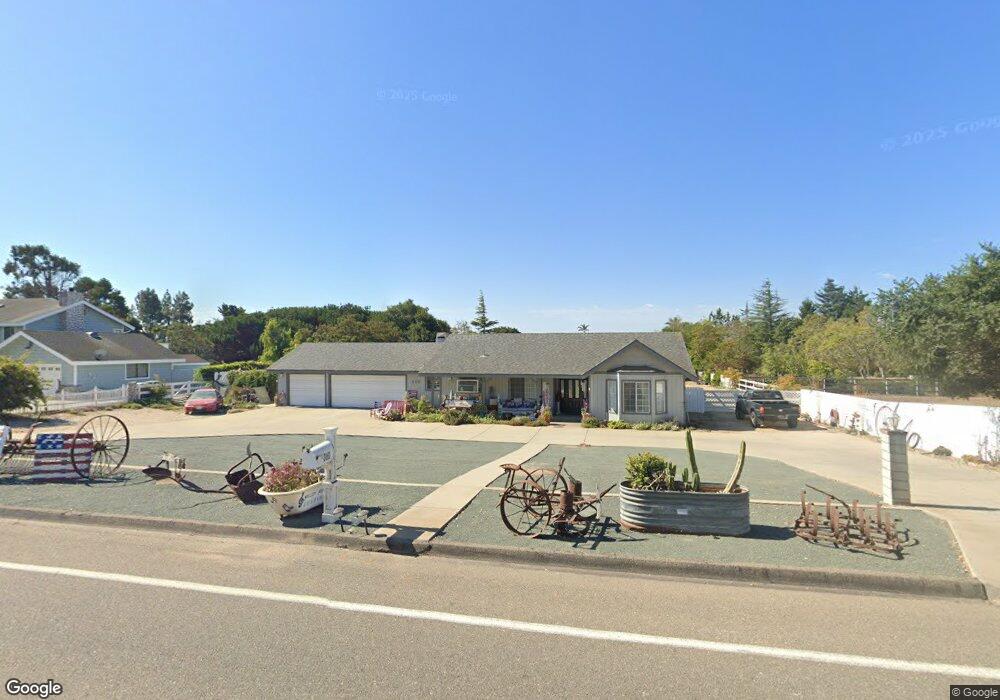
360 S Las Flores Dr Nipomo, CA 93444
Estimated Value: $997,813 - $1,041,000
4
Beds
2
Baths
2,000
Sq Ft
$513/Sq Ft
Est. Value
About This Home
This home is located at 360 S Las Flores Dr, Nipomo, CA 93444 and is currently estimated at $1,025,203, approximately $512 per square foot. 360 S Las Flores Dr is a home located in San Luis Obispo County with nearby schools including Dorothea Lange Elementary School, Mesa Middle School, and Nipomo High School.
Ownership History
Date
Name
Owned For
Owner Type
Purchase Details
Closed on
Aug 5, 2019
Sold by
Melody Daryl G and Conahan Melody Daryl G
Bought by
Melody Daryl G
Current Estimated Value
Home Financials for this Owner
Home Financials are based on the most recent Mortgage that was taken out on this home.
Original Mortgage
$1,014,000
Outstanding Balance
$896,814
Interest Rate
4.19%
Mortgage Type
Reverse Mortgage Home Equity Conversion Mortgage
Estimated Equity
$128,389
Purchase Details
Closed on
Mar 3, 2011
Sold by
Melody Philip D and Melody Daryl G
Bought by
Melody Philip D and Melody Daryl G Conahan
Home Financials for this Owner
Home Financials are based on the most recent Mortgage that was taken out on this home.
Original Mortgage
$326,000
Interest Rate
2.75%
Mortgage Type
Adjustable Rate Mortgage/ARM
Purchase Details
Closed on
Oct 15, 1997
Sold by
Ward David and Warwick Ward Debra
Bought by
Melody Philip D and Melody Daryl G
Home Financials for this Owner
Home Financials are based on the most recent Mortgage that was taken out on this home.
Original Mortgage
$175,200
Interest Rate
7.31%
Create a Home Valuation Report for This Property
The Home Valuation Report is an in-depth analysis detailing your home's value as well as a comparison with similar homes in the area
Home Values in the Area
Average Home Value in this Area
Purchase History
| Date | Buyer | Sale Price | Title Company |
|---|---|---|---|
| Melody Daryl G | -- | First American Title Souther | |
| Melody Philip D | -- | Fidelity National Title Co | |
| Melody Philip D | $219,000 | Cuesta Title Company |
Source: Public Records
Mortgage History
| Date | Status | Borrower | Loan Amount |
|---|---|---|---|
| Open | Melody Daryl G | $1,014,000 | |
| Closed | Melody Philip D | $326,000 | |
| Previous Owner | Melody Philip D | $175,200 |
Source: Public Records
Tax History Compared to Growth
Tax History
| Year | Tax Paid | Tax Assessment Tax Assessment Total Assessment is a certain percentage of the fair market value that is determined by local assessors to be the total taxable value of land and additions on the property. | Land | Improvement |
|---|---|---|---|---|
| 2025 | $3,523 | $349,656 | $159,660 | $189,996 |
| 2024 | $3,481 | $342,801 | $156,530 | $186,271 |
| 2023 | $3,481 | $336,080 | $153,461 | $182,619 |
| 2022 | $3,427 | $329,491 | $150,452 | $179,039 |
| 2021 | $3,591 | $323,031 | $147,502 | $175,529 |
| 2020 | $3,380 | $319,720 | $145,990 | $173,730 |
| 2019 | $3,357 | $313,452 | $143,128 | $170,324 |
| 2018 | $3,316 | $307,307 | $140,322 | $166,985 |
| 2017 | $3,252 | $301,282 | $137,571 | $163,711 |
| 2016 | $3,066 | $295,375 | $134,874 | $160,501 |
| 2015 | $3,021 | $290,940 | $132,849 | $158,091 |
| 2014 | $2,907 | $285,242 | $130,247 | $154,995 |
Source: Public Records
Map
Nearby Homes
- 1655 Kirby Way
- 1431 La Loma Dr
- 1765 Division St
- 468 Neptune Dr
- 1180 Starlite Dr
- 1127 Starlite Dr
- 393 Uranus Ct
- 426 Polaris Dr
- 457 Polaris Dr
- 945 Jeanette Ln
- 261 Hazel Ln
- 840 Story St
- 522 Higos Way
- 725 Monarch Ln
- 585 Via Mira Valle
- 483 Violet Ave
- 7855 Suey Creek Rd
- 1685 Scenic View Way
- 161 Lot Scenic View Way
- 0 Scenic View Way
- 380 S Las Flores Dr
- 365 S Las Flores Dr
- 1625 Country Hill Rd
- 355 S Las Flores Dr
- 1655 Country Hill Rd
- 1635 Country Hill Rd
- 410 S Las Flores Dr
- 1560 Los Padres Dr
- 1626 Kirby Way
- 365 Silva Place
- 1670 Country Hill Rd
- 1551 Country Hill Rd
- 375 Silva Place
- 1561 Los Padres Rd
- 1561 Los Padres Rd
- 360 Aspen Ct
- 385 Silva Place
- 1631 Kirby Way
- 1620 Country Hill Rd
- 1640 Country Hill Rd