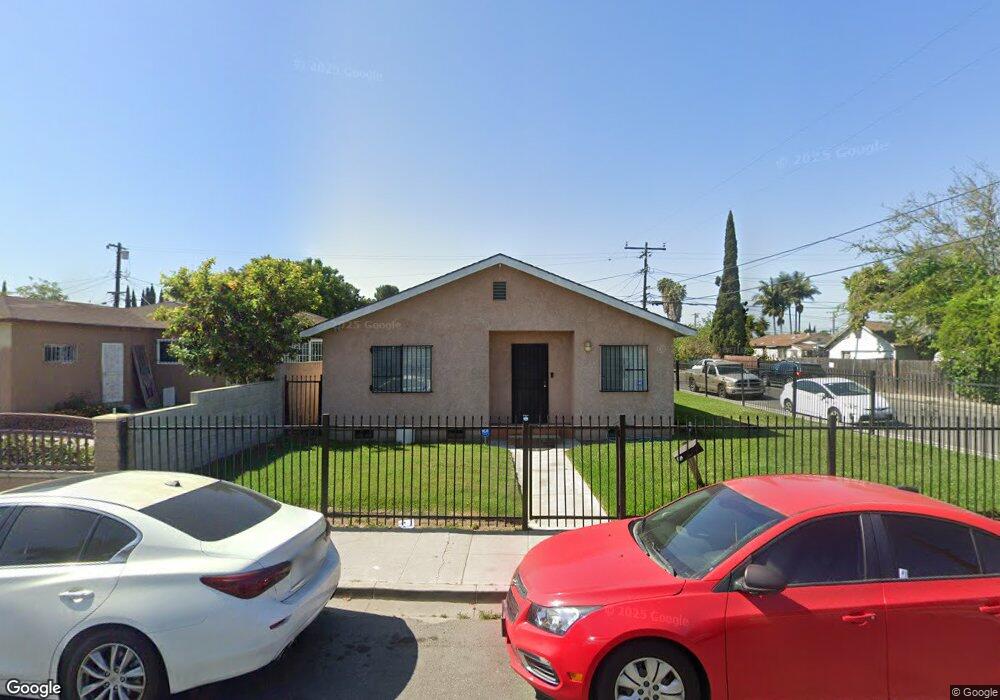
360 W Pear St Compton, CA 90222
Estimated Value: $624,143 - $662,000
3
Beds
2
Baths
1,305
Sq Ft
$490/Sq Ft
Est. Value
About This Home
This home is located at 360 W Pear St, Compton, CA 90222 and is currently estimated at $639,036, approximately $489 per square foot. 360 W Pear St is a home located in Los Angeles County with nearby schools including Rosecrans Elementary School, Benjamin O. Davis Middle School, and Compton High School.
Ownership History
Date
Name
Owned For
Owner Type
Purchase Details
Closed on
Mar 5, 2024
Sold by
Bentley Timothy D
Bought by
Timothy D Bentley Family Trust and Bentley
Current Estimated Value
Purchase Details
Closed on
May 22, 2003
Sold by
Secretary Of Hsng & Urban Dev Of Wa Dc
Bought by
Bentley Timothy D
Home Financials for this Owner
Home Financials are based on the most recent Mortgage that was taken out on this home.
Original Mortgage
$114,246
Interest Rate
5.46%
Mortgage Type
FHA
Purchase Details
Closed on
Feb 18, 2003
Sold by
Washington Mutual Bank Fa
Bought by
Hud
Purchase Details
Closed on
Sep 3, 2002
Sold by
Cortez Rosa
Bought by
Homeside Lending Inc
Purchase Details
Closed on
Sep 27, 2000
Sold by
Saavedra Jaime R and Saavedra Maria Delcarmen
Bought by
Cortez Rosa
Home Financials for this Owner
Home Financials are based on the most recent Mortgage that was taken out on this home.
Original Mortgage
$114,973
Interest Rate
7.11%
Mortgage Type
FHA
Create a Home Valuation Report for This Property
The Home Valuation Report is an in-depth analysis detailing your home's value as well as a comparison with similar homes in the area
Home Values in the Area
Average Home Value in this Area
Purchase History
| Date | Buyer | Sale Price | Title Company |
|---|---|---|---|
| Timothy D Bentley Family Trust | -- | None Listed On Document | |
| Bentley Timothy D | $106,000 | None Available | |
| Hud | $126,013 | -- | |
| Homeside Lending Inc | $126,013 | -- | |
| Cortez Rosa | $116,000 | Stewart Title |
Source: Public Records
Mortgage History
| Date | Status | Borrower | Loan Amount |
|---|---|---|---|
| Previous Owner | Bentley Timothy D | $53,000 | |
| Previous Owner | Bentley Timothy D | $114,246 | |
| Previous Owner | Cortez Rosa | $114,973 |
Source: Public Records
Tax History
| Year | Tax Paid | Tax Assessment Tax Assessment Total Assessment is a certain percentage of the fair market value that is determined by local assessors to be the total taxable value of land and additions on the property. | Land | Improvement |
|---|---|---|---|---|
| 2025 | $4,157 | $201,444 | $120,557 | $80,887 |
| 2024 | $4,157 | $197,495 | $118,194 | $79,301 |
| 2023 | $4,099 | $193,624 | $115,877 | $77,747 |
| 2022 | $3,565 | $189,828 | $113,605 | $76,223 |
| 2021 | $3,594 | $186,107 | $111,378 | $74,729 |
| 2019 | $3,495 | $180,588 | $108,075 | $72,513 |
| 2018 | $3,373 | $177,048 | $105,956 | $71,092 |
| 2016 | $3,210 | $170,176 | $101,843 | $68,333 |
| 2015 | $3,074 | $167,621 | $100,314 | $67,307 |
| 2014 | $3,023 | $164,338 | $98,349 | $65,989 |
Source: Public Records
Map
Nearby Homes
- 348 W Peach St
- 2223 E Oris St
- 363 W Spruce St
- 521 W Cherry St
- 418 W Spruce St
- 522 W Cherry St
- 905 N Hickory Ave
- 2062 E Hatchway St
- 2121 E Piru St
- 124 W Rosecrans Ave
- 2107 E Stockwell St
- 315 W Cedar St
- 2310 E Stockwell St
- 629 W Plum St
- 1111 N Mulberry St
- 701 W 139th St
- 2102 E Lucien St
- 212 E Rosecrans Ave
- 1608 N Grape Ave
- 720 W 137th St
Your Personal Tour Guide
Ask me questions while you tour the home.