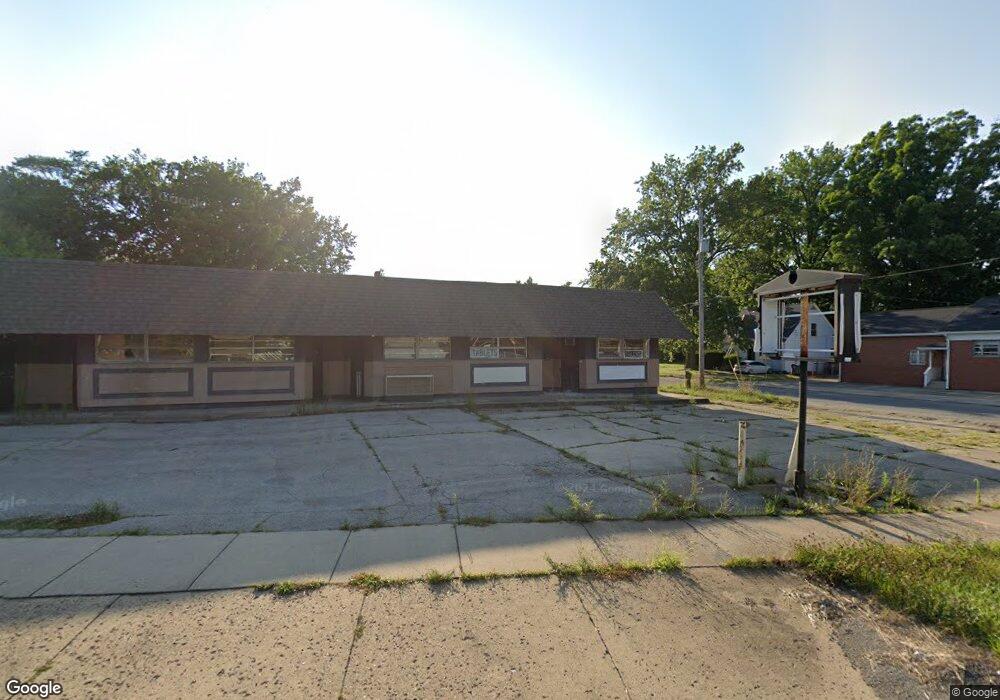
3600 Southern Blvd Youngstown, OH 44507
Cottage Grove Neighborhood
--
Bed
--
Bath
5,900
Sq Ft
6,970
Sq Ft Lot
About This Home
This home is located at 3600 Southern Blvd, Youngstown, OH 44507. 3600 Southern Blvd is a home located in Mahoning County with nearby schools including Taft Elementary School, East High School, and Horizon Science Academy - Youngstown.
Ownership History
Date
Name
Owned For
Owner Type
Purchase Details
Closed on
Jul 13, 2022
Bought by
Dab Property Group Ltd
Purchase Details
Closed on
Jun 22, 2022
Sold by
Atlanta Group Llc
Bought by
Dab Property Group Ltd
Purchase Details
Closed on
Oct 22, 2015
Sold by
Afp Enterprises Inc
Bought by
Atlanta Group Llc
Purchase Details
Closed on
Sep 26, 2005
Sold by
Pantaleo Mary E and The Mahoning National Bank Of
Bought by
Neapolitan Carmen and Parker Benjamin D
Home Financials for this Owner
Home Financials are based on the most recent Mortgage that was taken out on this home.
Original Mortgage
$91,200
Interest Rate
6.01%
Mortgage Type
Commercial
Purchase Details
Closed on
Sep 22, 2005
Sold by
Neapolitan Carmen and Neapolitan Jennifer
Bought by
Afp Enterprises
Home Financials for this Owner
Home Financials are based on the most recent Mortgage that was taken out on this home.
Original Mortgage
$91,200
Interest Rate
6.01%
Mortgage Type
Commercial
Purchase Details
Closed on
Sep 27, 1984
Bought by
Mah Ntl Bk Tr
Create a Home Valuation Report for This Property
The Home Valuation Report is an in-depth analysis detailing your home's value as well as a comparison with similar homes in the area
Home Values in the Area
Average Home Value in this Area
Purchase History
| Date | Buyer | Sale Price | Title Company |
|---|---|---|---|
| Dab Property Group Ltd | $10,000 | -- | |
| Dab Property Group Ltd | $10,000 | None Listed On Document | |
| Atlanta Group Llc | -- | Attorney | |
| Neapolitan Carmen | $55,000 | -- | |
| Afp Enterprises | $114,000 | -- | |
| Mah Ntl Bk Tr | -- | -- |
Source: Public Records
Mortgage History
| Date | Status | Borrower | Loan Amount |
|---|---|---|---|
| Previous Owner | Afp Enterprises | $91,200 |
Source: Public Records
Tax History Compared to Growth
Tax History
| Year | Tax Paid | Tax Assessment Tax Assessment Total Assessment is a certain percentage of the fair market value that is determined by local assessors to be the total taxable value of land and additions on the property. | Land | Improvement |
|---|---|---|---|---|
| 2024 | $1,030 | $14,320 | $1,810 | $12,510 |
| 2023 | $1,032 | $14,320 | $1,810 | $12,510 |
| 2022 | $763 | $18,270 | $2,260 | $16,010 |
| 2021 | $1,464 | $18,270 | $2,260 | $16,010 |
| 2020 | $1,476 | $18,270 | $2,260 | $16,010 |
| 2019 | $1,512 | $18,270 | $2,260 | $16,010 |
| 2018 | $1,764 | $18,270 | $2,260 | $16,010 |
| 2017 | $1,524 | $18,270 | $2,260 | $16,010 |
| 2016 | $1,496 | $18,370 | $2,260 | $16,110 |
| 2015 | $1,464 | $18,370 | $2,260 | $16,110 |
| 2014 | $1,450 | $18,370 | $2,260 | $16,110 |
| 2013 | $1,425 | $18,370 | $2,260 | $16,110 |
Source: Public Records
Map
Nearby Homes
- 116 Hilton Ave
- 131 E Ravenwood Ave Unit 133
- 159 E Ravenwood Ave
- 161 E Auburndale Ave
- 3916 Howard St
- 182 E Auburndale Ave
- 188 Clarencedale Ave
- 207 E Lucius Ave
- 230 Clarencedale Ave
- 144 Brooklyn Ave
- 123 E Boston Ave
- 102 E Boston Ave
- 4144 Helena Ave
- 3401 Idlewood Ave Unit 403
- 3303 Idlewood Ave Unit 305
- 204 Lowell Ave
- 28 W Philadelphia Ave
- 24 W Philadelphia Ave
- 3114 Hillman St
- 4307 Helena Ave
- 85 Hilton Ave Unit 87
- 3620 Southern Blvd
- 3628 Southern Blvd
- 75 Hilton Ave
- 88 Hilton Ave
- 88 Hilton Ave
- 84 Hilton Ave
- 106 E Judson Ave
- 71 Hilton Ave
- 101 Hilton Ave Unit 103
- 76 Hilton Ave Unit 78
- 72 E Judson Ave
- 103 Hilton Ave
- 67 Hilton Ave Unit 69
- 67 Hilton Ave
- 110 E Judson Ave
- 68 Hilton Ave
- 105 Hilton Ave
- 68 E Judson Ave
- 65 Hilton Ave