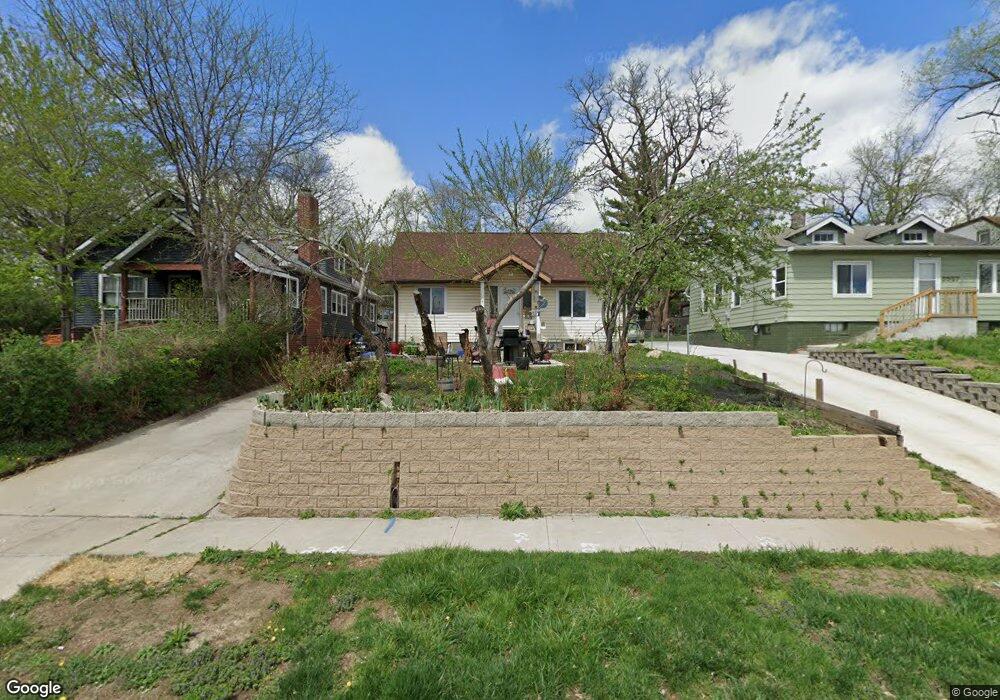
3601 Crocker St Des Moines, IA 50312
Drake NeighborhoodEstimated Value: $161,066 - $202,000
3
Beds
1
Bath
832
Sq Ft
$215/Sq Ft
Est. Value
About This Home
This home is located at 3601 Crocker St, Des Moines, IA 50312 and is currently estimated at $178,517, approximately $214 per square foot. 3601 Crocker St is a home located in Polk County with nearby schools including Hubbell Elementary, Roosevelt High School, and St Augustin Catholic School.
Ownership History
Date
Name
Owned For
Owner Type
Purchase Details
Closed on
Apr 9, 2001
Sold by
Bannick Alice Mae and Bannick Alice M
Bought by
Reyes Alex Balmore
Current Estimated Value
Home Financials for this Owner
Home Financials are based on the most recent Mortgage that was taken out on this home.
Original Mortgage
$69,903
Outstanding Balance
$25,473
Interest Rate
7.03%
Mortgage Type
FHA
Estimated Equity
$153,044
Purchase Details
Closed on
Apr 8, 2001
Sold by
Reyes Alex Balmore and Reyes Lorena
Bought by
Ruiz Guillermina
Home Financials for this Owner
Home Financials are based on the most recent Mortgage that was taken out on this home.
Original Mortgage
$69,903
Outstanding Balance
$25,473
Interest Rate
7.03%
Mortgage Type
FHA
Estimated Equity
$153,044
Purchase Details
Closed on
Apr 12, 1997
Sold by
Bannick Alice M
Bought by
Reyes Alex Balmore
Create a Home Valuation Report for This Property
The Home Valuation Report is an in-depth analysis detailing your home's value as well as a comparison with similar homes in the area
Home Values in the Area
Average Home Value in this Area
Purchase History
| Date | Buyer | Sale Price | Title Company |
|---|---|---|---|
| Reyes Alex Balmore | $59,000 | -- | |
| Ruiz Guillermina | $70,500 | -- | |
| Reyes Alex Balmore | $54,500 | -- |
Source: Public Records
Mortgage History
| Date | Status | Borrower | Loan Amount |
|---|---|---|---|
| Open | Ruiz Guillermina | $69,903 |
Source: Public Records
Tax History Compared to Growth
Tax History
| Year | Tax Paid | Tax Assessment Tax Assessment Total Assessment is a certain percentage of the fair market value that is determined by local assessors to be the total taxable value of land and additions on the property. | Land | Improvement |
|---|---|---|---|---|
| 2025 | $2,594 | $145,700 | $48,400 | $97,300 |
| 2024 | $2,594 | $131,900 | $43,800 | $88,100 |
| 2023 | $2,674 | $131,900 | $43,800 | $88,100 |
| 2022 | $2,654 | $113,500 | $38,400 | $75,100 |
| 2021 | $2,532 | $113,500 | $38,400 | $75,100 |
| 2020 | $2,632 | $101,500 | $34,600 | $66,900 |
| 2019 | $2,402 | $101,500 | $34,600 | $66,900 |
| 2018 | $2,378 | $89,400 | $30,100 | $59,300 |
| 2017 | $2,204 | $89,400 | $30,100 | $59,300 |
| 2016 | $2,148 | $81,500 | $27,400 | $54,100 |
| 2015 | $2,148 | $81,500 | $27,400 | $54,100 |
| 2014 | $2,038 | $76,700 | $25,600 | $51,100 |
Source: Public Records
Map
Nearby Homes